Mouse Model for Cardiac Hypertrophy (CH) ")

Myocardial Hypertrophy; Ventricular hypertrophy
- UOM
- FOB US$ 300.00
- Quantity
Overview
Properties
- Product No.DSI548Mu01
- Organism SpeciesMus musculus (Mouse) Same name, Different species.
- ApplicationsDisease Model
Research use only - Downloadn/a
- Category
- Prototype SpeciesHuman
- Sourceinduced by partial coarctation in the abdominal aorta
- Model Animal StrainsC57BL/6 Mice (SPF) healthy, male, age:8~10w, bodyweight: 23g~27g
- Modeling GroupingRandomly divided into six group: Control group, Model group, Positive drug group and Test drug group (three doses) n=15.
- Modeling Period8w
Sign into your account
Share a new citation as an author
Upload your experimental result
Review

Contact us
Please fill in the blank.
-
 Packages (Simulation)
-
 Packages (Simulation)
-
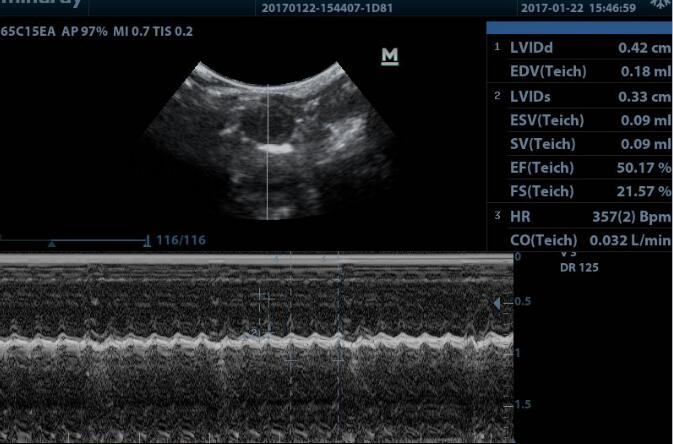 M-mode ultrasonography image for heart in mouse
-
 ISO9001: 2008, ISO13485: 2003 Registered
Modeling Method
1. Mice were anesthetized with 3% pentobarbital sodium (80mg/kg) by intraperitoneal injection.
2. Shave the hair on the right-hand side of the right kidney and sternal parts with a shaving razor, and make a disinfection with alcohol and iodine.
3. Make an open cut of about 1cm incision on the right side of the rib, separation of the right kidney tissue fat. Isolating the right kidney medial abdominal aorta with microforceps.
4. Use 7-0 aseptic silk to go through the separation of abdominal aorta, according to the body weight of mice, to use the right needle to fasten thread, and then pad out needle, causing about 60% stenosis.
5. Cut the excess thread, remove the cotton balls, injected 0.5ml saline, suture muscle layer and skin with 5-0 silk, coated with iodine disinfection.
6. 4 weeks after abdominal aorta coarctation in mice, the hypertensive ventricular hypertrophy was established, and the heart failure could be reached in 8 weeks.
Model evaluation
1. Cardiac function test: the changes of left ventricular end diastolic diameter (LVEDD), left ventricular end systolic diameter (LVEDS), ejection fraction (EF%) short axis shortening (FS%) were measured by echocardiography;
2.The ratio of heart weight to body weight (HW/BW), the ratio of lung weight to body weight (LW/BW), the ratio of heart weight to tibia length (HW/TL);
Pathological results
HE staining showed that the volume of myocardial cells was increased, and the number of myocardial cells per unit area was decreased. PSR staining showed that the interstitial collagen increased and the degree of fibrosis increased;
Cytokines level
Cardiac hypertrophy markers peptide (atrial natriuretic, ANP), brain natriuretic peptide (brain natriuretic peptide, BNP), myosin heavy chain (-MHC) were increased.
Statistical analysis
SPSS software is used for statistical analysis, measurement data to mean ± standard deviation (x ±s), using t test and single factor analysis of variance for group comparison , P<0.05 indicates there was a significant difference, P<0.01 indicates there are very significant differences.
Giveaways

Increment services
-
 Tissue/Sections Customized Service
-
 Serums Customized Service
-
 Immunohistochemistry (IHC) Experiment Service
-
 Small Animal In Vivo Imaging Experiment Service
-
 Small Animal Micro CT Imaging Experiment Service
-
 Small Animal MRI Imaging Experiment Service
-
 Small Animal Ultrasound Imaging Experiment Service
-
 Transmission Electron Microscopy (TEM) Experiment Service
-
 Scanning Electron Microscope (SEM) Experiment Service
-
 Learning and Memory Behavioral Experiment Service
-
 Anxiety and Depression Behavioral Experiment Service
-
 Drug Addiction Behavioral Experiment Service
-
 Pain Behavioral Experiment Service
-
 Neuropsychiatric Disorder Behavioral Experiment Service
-
 Fatigue Behavioral Experiment Service
-
 Nitric Oxide Assay Kit (A012)
-
 Nitric Oxide Assay Kit (A013-2)
-
 Total Anti-Oxidative Capability Assay Kit(A015-2)
-
 Total Anti-Oxidative Capability Assay Kit (A015-1)
-
 Superoxide Dismutase Assay Kit
-
 Fructose Assay Kit (A085)
-
 Citric Acid Assay Kit (A128 )
-
 Catalase Assay Kit
-
 Malondialdehyde Assay Kit
-
 Glutathione S-Transferase Assay Kit
-
 Microscale Reduced Glutathione assay kit
-
 Glutathione Reductase Activity Coefficient Assay Kit
-
 Angiotensin Converting Enzyme Kit
-
 Glutathione Peroxidase (GSH-PX) Assay Kit
-
 Cloud-Clone Multiplex assay kits