Rat Model for Diabetes Mellitus (DM) ")

Diabetes
- UOM
- FOB US$ 240.00
- Quantity
Overview
Properties
- Product No.DSI521Ra01
- Organism SpeciesRattus norvegicus (Rat) Same name, Different species.
- ApplicationsDisease Model
Research use only - Downloadn/a
- Category
- Prototype SpeciesHuman
- SourceStreptozocin(STZ ) induced
- Model Animal StrainsSD rats (SPF), Male, age:4w~6w, body weight :180g~200g.
- Modeling GroupingRandomly divided into six group: Control group, Model group, Positive drug group and Test drug group (three doses).
- Modeling Period4w
Sign into your account
Share a new citation as an author
Upload your experimental result
Review

Contact us
Please fill in the blank.
-
 Packages (Simulation)
-
 Packages (Simulation)
-
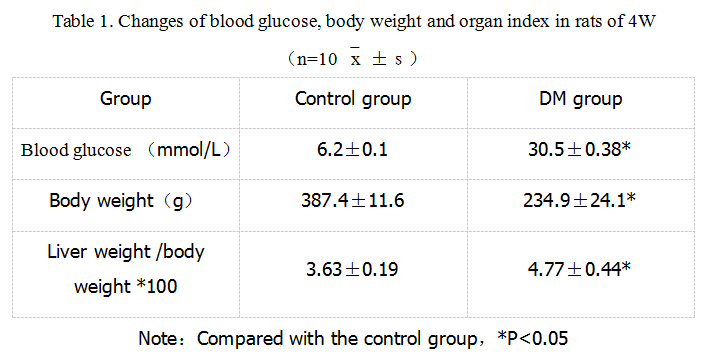 Changes of blood glucose, body weight and organ index in rats of 4W
-
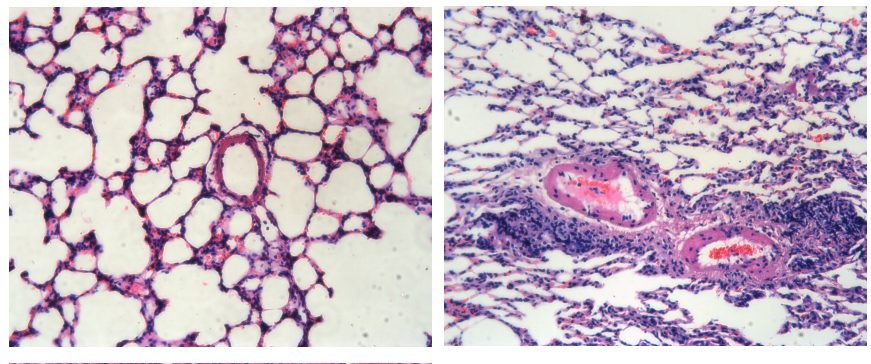 HE staining,Left:lung of Control group,Right:Lung of DM group
-
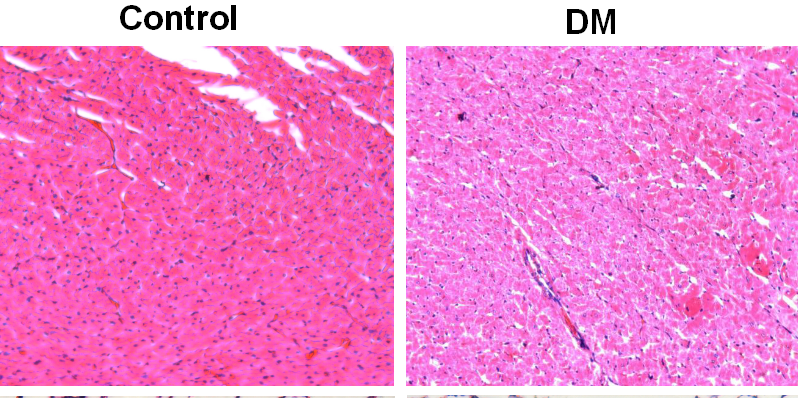 Fig. HE staining of Heart, Left:control group,Right:DM group.
-
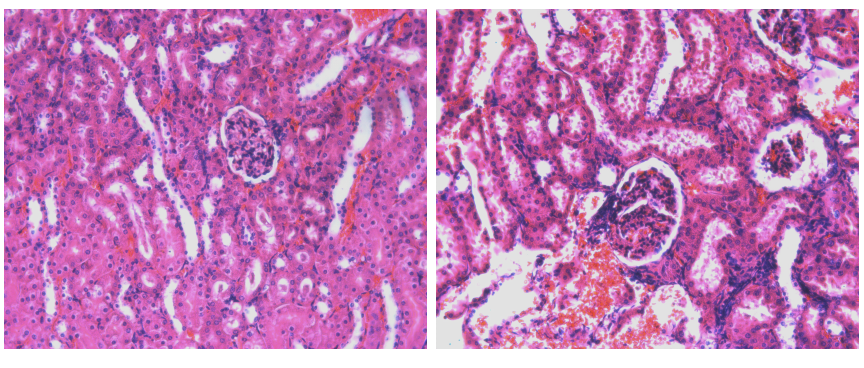 Fig. HE staining of Kidney,Left:Control group, Right:DM group
-
 ISO9001: 2008, ISO13485: 2003 Registered
Modeling Method
STZ solution preparation: Streptozocin(STZ) dissolved in 0.1 mol/L sodium citrate buffer, freshly prepared STZ solution of 10 mg/mL concentration and 0.22 M filter bacteria filtration sterilization. Attention to avoid light preparation.
Modeling:
1. Fasting for 12 hours before the operation.
2. Rats in model group are injected intraperitoneally with STZ 55mg/kg, and the control group are given the same dose of sodium citrate buffer.
3. 7d After injection of STZ, measure fasting blood glucose, selecte the rats' blood glucose 13.5-25mmol/L into the formal experiment.
4 after STZ injection, measure blood glucose and body weight every week, and the change of body weight and blood glucose are recorded.
5.4 wekkafter testing the weight and fasting blood glucose of rats in each group on 4th week.
collecte the blood samples, 2h after room temperature static 3000r at 4℃ for 10 minutes to get the serum. Yellow fat, subcutaneous fat, skeletal muscle, white fat, liver, lung, heart, kidney are taken for pathological and molecular biological testing.
Model evaluation
1. General observation: rats in the control group:the moderate size, a good mental state, action freely, sensitive reaction, procumbent hair luster. And diabetic rats : weight becomes lighter, spirit dispirited, unresponsive, vertical hair dull, slow,urine volume increased significantly.Compared with control group, the body weight of diabetic rats is significantly reduced, heart coefficient, liver coefficient are significantly increased compared with the control group, and has statistical significance.
2. Changes in fasting blood glucose, triglycerides and total cholesterol levels:
There are no significant differences in fasting blood glucose, triglyceride and total cholesterol levels between the two groups before and after the experiment;
The levels of fasting blood glucose, triglyceride and total cholesterol in the model group were significantly higher than those in the control group,
Pathological results
1.Changes of cardiac tissue morphology in diabetic rats
By HE staining: in control group, the cardiac muscle fiber arranged in neat rows, dense, clear structure, nuclei with evenly distributed chromatin, less extracellular matrix, micro vascular structure normal, visible a few fibroblasts, interstitial free obvious inflammatory cell infiltration;
in diabetic model group, the cardiac muscle fiber arranged in disorder, myocardial hypertrophy, intercellular space increased, structure is clear, some cell membrane blebbing, nuclear pyknosis and infiltration of inflammatory cells and muscle cells also visible fiber cell infiltration.
2. Changes of liver tissue morphology in diabetic rats
By oil red O staining, the liver lipid droplets in the liver of diabetic rats are larger, the red lipid droplets are obvious, and the liver showes significant lipid deposition.
Cytokines level
Statistical analysis
SPSS software is used for statistical analysis, measurement data to mean ± standard deviation (x ±s), using t test and single factor analysis of variance for group comparison , P<0.05 indicates there was a significant difference, P<0.01 indicates there are very significant differences.
Giveaways

Increment services
-
 Tissue/Sections Customized Service
-
 Serums Customized Service
-
 Immunohistochemistry (IHC) Experiment Service
-
 Small Animal In Vivo Imaging Experiment Service
-
 Small Animal Micro CT Imaging Experiment Service
-
 Small Animal MRI Imaging Experiment Service
-
 Small Animal Ultrasound Imaging Experiment Service
-
 Transmission Electron Microscopy (TEM) Experiment Service
-
 Scanning Electron Microscope (SEM) Experiment Service
-
 Learning and Memory Behavioral Experiment Service
-
 Anxiety and Depression Behavioral Experiment Service
-
 Drug Addiction Behavioral Experiment Service
-
 Pain Behavioral Experiment Service
-
 Neuropsychiatric Disorder Behavioral Experiment Service
-
 Fatigue Behavioral Experiment Service
-
 Nitric Oxide Assay Kit (A012)
-
 Nitric Oxide Assay Kit (A013-2)
-
 Total Anti-Oxidative Capability Assay Kit(A015-2)
-
 Total Anti-Oxidative Capability Assay Kit (A015-1)
-
 Superoxide Dismutase Assay Kit
-
 Fructose Assay Kit (A085)
-
 Citric Acid Assay Kit (A128 )
-
 Catalase Assay Kit
-
 Malondialdehyde Assay Kit
-
 Glutathione S-Transferase Assay Kit
-
 Microscale Reduced Glutathione assay kit
-
 Glutathione Reductase Activity Coefficient Assay Kit
-
 Angiotensin Converting Enzyme Kit
-
 Glutathione Peroxidase (GSH-PX) Assay Kit
-
 Cloud-Clone Multiplex assay kits