Rat Model for Dystonia (DT) ")

- UOM
- FOB US$ 240.00
- Quantity
Overview
Properties
- Product No.DSI839Ra01
- Organism SpeciesRattus norvegicus (Rat) Same name, Different species.
- ApplicationsDisease Model
Research use only - Downloadn/a
- CategorySkeletal, articular and cutaneous systems
- Prototype SpeciesHuman
- SourceInduced by 3- nitropropionic acid (3-NP)
- Model Animal StrainsSD rats(SPF class), healthy, 6~8W, body weight:180g-200g
- Modeling GroupingRandomly divided into six group: Control group, Model group, Positive drug group and Test drug group(low,medium,high)
- Modeling Period2~4w
Sign into your account
Share a new citation as an author
Upload your experimental result
Review

Contact us
Please fill in the blank.
-
 Packages (Simulation)
-
 Packages (Simulation)
-
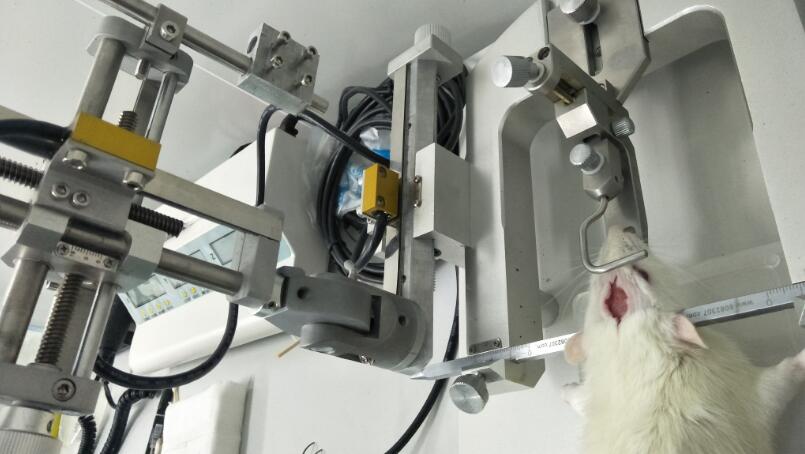 Fig. The stereotaxic operation on the rat brain
-
 ISO9001: 2008, ISO13485: 2003 Registered
Modeling Method
1. Modeling and identification of dystonia in rats
1.1 Modeling method
The experiment was conducted after adaptive feeding of male SD rats for a week .After anesthesia, the rats in the model group were fixed on the stereotaxic instrument. The coordinates of the left caudate putamen were determined to be 1mm of bregma, 3mm on the left side of the sagittal suture, and ~7mm of dura mater. Routine disinfection was performed, the skin and subcutaneous tissues of the head were cut, the outer membrane of the skull was bluntly separated, the anterior fontanelle and the left skull were fully exposed, and the skull was drilled open (be careful not to damage the dura). 3-NP solution (1000nmol/ul) was injected into the target with a microsyringe, 4ul per injection. 4~7 points were injected subdural, and the needle was left for 5 minutes after the injection, and the needle was withdrawn slowly. The control group was injected with normal saline at the same site. The animals were routinely fed in the same environment after operation.
Model evaluation
1.Flat score:
Before modeling, all animals were trained on a flat: a narrow flat, 120cm long and 7cm wide, was placed between two platforms 1m high from the ground. All rats were trained 3 times a day for 7 days to ensure that each rat could successfully pass the flat plate without stopping in between. The time and number of steps taken by each rat through the tablet were recorded to calculate stride length.
Five days after the operation, animals in each group were subjected to the flat test, and the time and number of steps of each rat were recorded to calculate the stride length.
2.Motor coordination test:
The motor coordination ability of rats was quantified by rotarod test.The rats' stay time on the rotating rod was tested at 9r/min and 18r/min respectively. Each animal was measured three times at each rotating speed and the average value was taken.
3.Take sample and detection:
The rats were sacrificed 7 days after operation for brain tissue and serum samples.
Pathological results
HE staining and Nissl staining:
Brain tissue was taken, embedded and sected, and HE staining and Nissl staining were performed to observe pathological changes, mainly observing the changes of neurons in striatum, midbrain and hippocampus.
Cytokines level
Statistical analysis
SPSS software is used for statistical analysis, measurement data to mean ± standard deviation (x ±s), using t test and single factor analysis of variance for group comparison , P<0.05 indicates there was a significant difference, P<0.01 indicates there are very significant differences.
Giveaways

Increment services
-
 Tissue/Sections Customized Service
-
 Serums Customized Service
-
 Immunohistochemistry (IHC) Experiment Service
-
 Small Animal In Vivo Imaging Experiment Service
-
 Small Animal Micro CT Imaging Experiment Service
-
 Small Animal MRI Imaging Experiment Service
-
 Small Animal Ultrasound Imaging Experiment Service
-
 Transmission Electron Microscopy (TEM) Experiment Service
-
 Scanning Electron Microscope (SEM) Experiment Service
-
 Learning and Memory Behavioral Experiment Service
-
 Anxiety and Depression Behavioral Experiment Service
-
 Drug Addiction Behavioral Experiment Service
-
 Pain Behavioral Experiment Service
-
 Neuropsychiatric Disorder Behavioral Experiment Service
-
 Fatigue Behavioral Experiment Service
-
 Nitric Oxide Assay Kit (A012)
-
 Nitric Oxide Assay Kit (A013-2)
-
 Total Anti-Oxidative Capability Assay Kit(A015-2)
-
 Total Anti-Oxidative Capability Assay Kit (A015-1)
-
 Superoxide Dismutase Assay Kit
-
 Fructose Assay Kit (A085)
-
 Citric Acid Assay Kit (A128 )
-
 Catalase Assay Kit
-
 Malondialdehyde Assay Kit
-
 Glutathione S-Transferase Assay Kit
-
 Microscale Reduced Glutathione assay kit
-
 Glutathione Reductase Activity Coefficient Assay Kit
-
 Angiotensin Converting Enzyme Kit
-
 Glutathione Peroxidase (GSH-PX) Assay Kit
-
 Cloud-Clone Multiplex assay kits