Mouse Model for Asthma ")

- UOM
- FOB US$ 150.00
- Quantity
Overview
Properties
- Product No.DSI528Mu01
- Organism SpeciesMus musculus (Mouse) Same name, Different species.
- ApplicationsTo study the pathogenesis of asthma and develop the drugs for therapy and prevention of asthma
Research use only - Downloadn/a
- Category
- Prototype SpeciesHuman
- SourceAlum and OVA induced
- Model Animal StrainsBalb/c mice (SPF level), male, week age: 4 week-6 week, body weight:20g~22g.
- Modeling GroupingRandomly divided into groups: Control group, Model group, Positive drug group and Test drug group, 15 rats per group.
- Modeling Period6 weeks
Sign into your account
Share a new citation as an author
Upload your experimental result
Review

Contact us
Please fill in the blank.
-
 Packages (Simulation)
-
 Packages (Simulation)
-
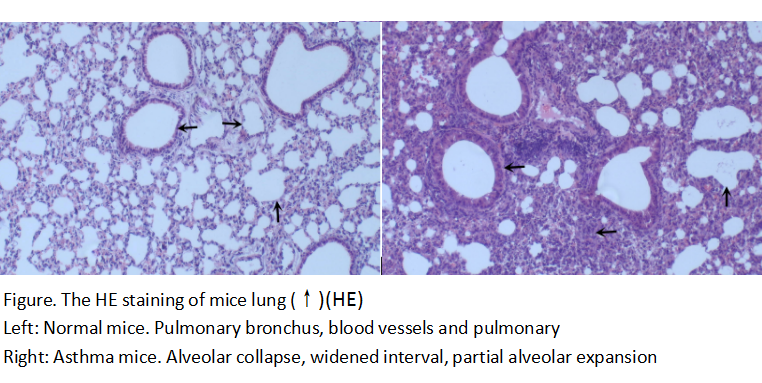 Figure. The HE staining of mice lung (↑)(HE)
-
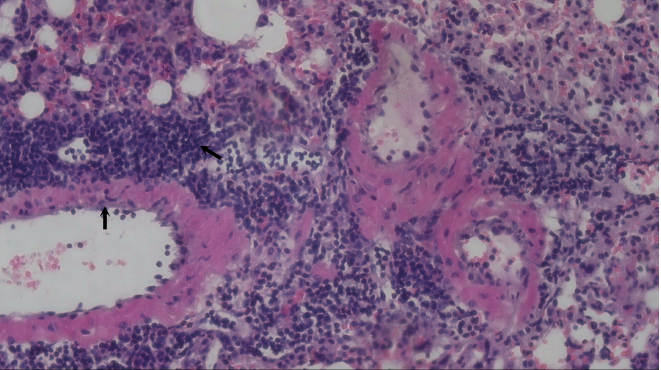 Asthma mice. The vascular wall thickening, inflammatory cell infiltration around, eosinophils increased significantly (arrow) (H-E)
-
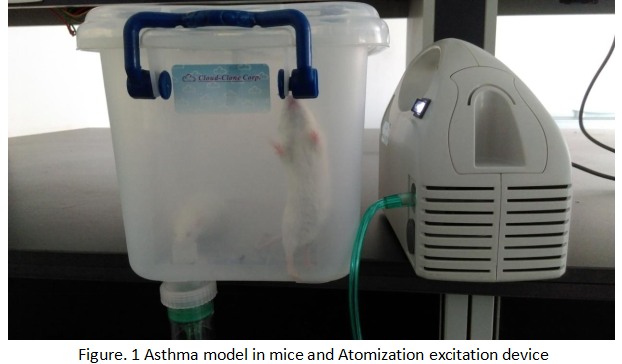 Fig 1. Atomizaion excitaion device for asthma model in mice
-
 ISO9001: 2008, ISO13485: 2003 Registered
Modeling Method
1. 10% alum solution (dissolved in double distilled water) 2ml, 500ug/ml OVA (dissolved in PBS) 2ml mixed in equal parts, using NaOH to adjust to the pH6.5, and incubated at room temperature for 60 min, 750r/min, 5min, remove supernatant, dissolved in 2ml PBS. Sensitized when each mouse intraperitoneal injection of 200ul, which contains 2mg alum and 100ug OVA.
2. Inject with alum 0.2ml to abdominal cavity in day 0, 14respectively, and the control group are injected the same dose of PBS solution.
3. Atomization inhalation, on day 21, the mice into the organic glass box, 5% OVA atomizing inhalation. 30min per day, last for 7 days, within 24h of the last inhalation, detect the sensitization. Mice with irritability, shortness of breath, abdominal muscle spasm and other positive reaction as the standard of a successful model. Control group using PBS atomizing inhalation, other operations are the same.
4.Pick the eye to take blood, 4℃, 3000r, 10 minutes to extract serum, stored at -80℃. The left lung tissue was fixed in 4% poly formaldehyde solution for pathological staining; the right lung tissue was frozen in liquid nitrogen and stored at -80℃.
Model evaluation
1. General observation:Asthma model mice after the excitation appear sneezing, nodding breathing, shortness of breath, wheezing sound, abdominal muscle contraction, irritability and other typical asthma symptoms, and eating less in the late, dull coat, bradykinesia, and weight gradually decreased.
2. Bronchial alveolar lavage fluid (BALF) collected at the 24h after first excitation (day 28). Separate the trachea, after ligation of the left main bronchus, cut the right main bronchus and insert the endotracheal tube and fixed, sterile saline lavage 3 times,1ML per time, collect BALF and 4℃,1200r/min,5 mins, the supernatant is discarded, PBS resuspends cell sedimentation,smear and classify the cells.
Pathological results
The left lung tissue is fixed with 4% formalin, dehydrated, embedded in paraffin, and stained with 4 m slice, HE staining. In the normal group, there was no obvious infiltration of inflammatory cells and normal structure. Asthma group showed diffuse small bronchial and vascular inflammatory cell infiltration, in which the number of eosinophils increased significantly. Airway epithelium has different degree of shedding, bronchial mucous membrane epithelial goblet cell hyperplasia, within the lumen of the visible mucous bolt and inflammatory exudative, marked thickening of bronchial smooth muscle, perivascular edema.
Cytokines level
The content of IL-25 and IL-4 in model group is significantly higher than that in control group. The content of IL-25 and IL-4 in serum is detected by ELISA kit.
Statistical analysis
SPSS software is used for statistical analysis, measurement data to mean ± standard deviation (x ±s), using t test and single factor analysis of variance for group comparison , P<0.05 indicates there was a significant difference, P<0.01 indicates there are very significant differences.
Giveaways

Increment services
-
 Tissue/Sections Customized Service
-
 Serums Customized Service
-
 Immunohistochemistry (IHC) Experiment Service
-
 Small Animal In Vivo Imaging Experiment Service
-
 Small Animal Micro CT Imaging Experiment Service
-
 Small Animal MRI Imaging Experiment Service
-
 Small Animal Ultrasound Imaging Experiment Service
-
 Transmission Electron Microscopy (TEM) Experiment Service
-
 Scanning Electron Microscope (SEM) Experiment Service
-
 Learning and Memory Behavioral Experiment Service
-
 Anxiety and Depression Behavioral Experiment Service
-
 Drug Addiction Behavioral Experiment Service
-
 Pain Behavioral Experiment Service
-
 Neuropsychiatric Disorder Behavioral Experiment Service
-
 Fatigue Behavioral Experiment Service
-
 Nitric Oxide Assay Kit (A012)
-
 Nitric Oxide Assay Kit (A013-2)
-
 Total Anti-Oxidative Capability Assay Kit(A015-2)
-
 Total Anti-Oxidative Capability Assay Kit (A015-1)
-
 Superoxide Dismutase Assay Kit
-
 Fructose Assay Kit (A085)
-
 Citric Acid Assay Kit (A128 )
-
 Catalase Assay Kit
-
 Malondialdehyde Assay Kit
-
 Glutathione S-Transferase Assay Kit
-
 Microscale Reduced Glutathione assay kit
-
 Glutathione Reductase Activity Coefficient Assay Kit
-
 Angiotensin Converting Enzyme Kit
-
 Glutathione Peroxidase (GSH-PX) Assay Kit
-
 Cloud-Clone Multiplex assay kits