Mouse Model for Cardiac Hypertrophy (CH) ")

Myocardial Hypertrophy; Ventricular hypertrophy
- UOM
- FOB US$
- Quantity
Overview
Properties
- Product No.DSI548Mu02
- Organism SpeciesMus musculus (Mouse) Same name, Different species.
- ApplicationsDisease Model
Research use only - Downloadn/a
- Category
- Prototype SpeciesHuman
- SourceSubcutaneously implanted osmotic pump(AngII)
- Model Animal StrainsTIPE2-/- Mice
- Modeling Grouping1.Randomly divided into six group: Control group, Model group, Positive drug group and Tested drug group.
- Modeling Period6w
Sign into your account
Share a new citation as an author
Upload your experimental result
Review

Contact us
Please fill in the blank.
-
 Packages (Simulation)
-
 Packages (Simulation)
-
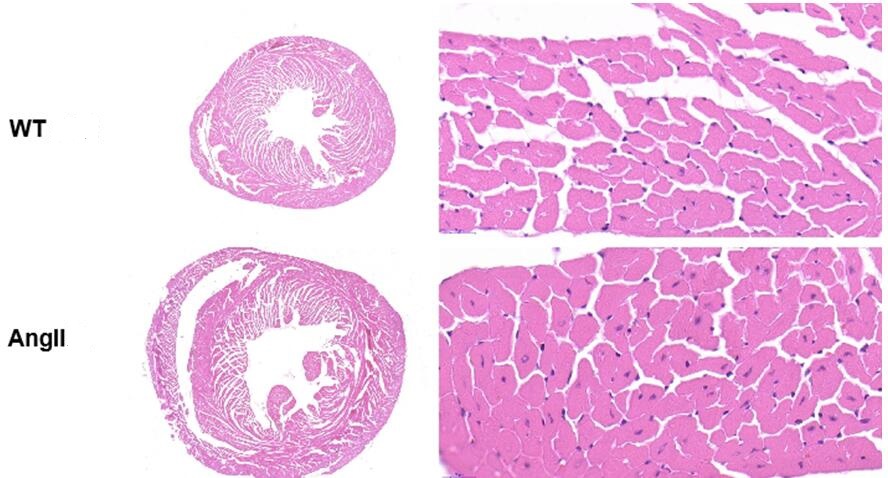 Fig. HE staining of mice heart
-
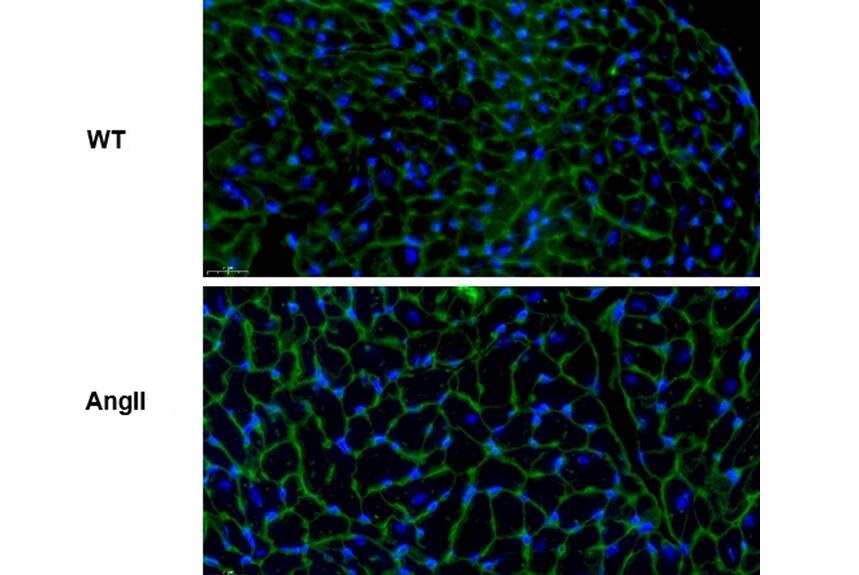 Fig. WGA fluorescence staining of mice heart
-
 ISO9001: 2008, ISO13485: 2003 Registered
Modeling Method
Model group was subcutaneously implanted with osmotic pump (AngII 1000ng/kg/min).
The control group was subcutaneously implanted with an osmotic pump with normal saline.
28 days later, the animals were killed and their hearts were taken for pathological examination.
Materials:
(1) At the end of the experiment, the animals were killed and the serum was taken
(2) The heart was weighed and photographed, and the aorta (complete aorta, aortic arch to renal artery) was photographed.
Model evaluation
Body weight and blood pressure (tail pressure method) were measured at 0d, 7d, 14d, 21d and 28d.
Cardiac function was measured by cardiac ultrasound at 0d, 14d and 28d.1.
Cardiac function evaluation: According to Laplace theorem, S=Pr/2h, P is the intracardiac pressure, R is the diameter of the heart cavity, and H is the thickness of the heart wall.In the case of cardiac pressure overload, in order to adapt to the increase of cardiac work, the thickness of the ventricular wall increases, the stress of the left ventricular wall increases, improve the cardiac systolic function and play an early compensatory mechanism. However, continuous pressure overload can promote cardiac hypertrophy, resulting in necrosis and apoptosis of cardiac myocytes, impaired systolic and/or diastolic function of the heart, and eventually development of chronic heart failure or even sudden cardiac death.Cardiac function can be assessed by ultrasound or hemodynamic testing.M-ultrasonography, the left ventricular end diastolic and end systolic diameter (LVIDd, LVIDs) will be measured, and the corresponding ejection fraction (EF%) and left ventricular short axis shortening rate (FS%) will be calculated automatically.
Pathological results
1.HE and Masson staining: Myocardial tissue was taken, embedded in paraffin and sectioned for HE and Masson staining.
2. Wheat germ lectin (WGA) : Wheat germ lectin (WGA) binds specifically to a glycoprotein on the myocardial cell membrane, and the combination of the two can stain the myocardial cell membrane.WGA can dye the myocardial cell membrane, and can directly compare mast cells with normal cells. It can also measure the diameter and area of the stained cells with special software, so as to analyze whether myocardial cells are hypertrophy or not.
Cytokines level
Statistical analysis
SPSS software is used for statistical analysis, measurement data to mean ± standard deviation (x ±s), using t test and single factor analysis of variance for group comparison , P<0.05 indicates there was a significant difference, P<0.01 indicates there are very significant differences.
Giveaways

Increment services
-
 Tissue/Sections Customized Service
-
 Serums Customized Service
-
 Immunohistochemistry (IHC) Experiment Service
-
 Small Animal In Vivo Imaging Experiment Service
-
 Small Animal Micro CT Imaging Experiment Service
-
 Small Animal MRI Imaging Experiment Service
-
 Small Animal Ultrasound Imaging Experiment Service
-
 Transmission Electron Microscopy (TEM) Experiment Service
-
 Scanning Electron Microscope (SEM) Experiment Service
-
 Learning and Memory Behavioral Experiment Service
-
 Anxiety and Depression Behavioral Experiment Service
-
 Drug Addiction Behavioral Experiment Service
-
 Pain Behavioral Experiment Service
-
 Neuropsychiatric Disorder Behavioral Experiment Service
-
 Fatigue Behavioral Experiment Service
-
 Nitric Oxide Assay Kit (A012)
-
 Nitric Oxide Assay Kit (A013-2)
-
 Total Anti-Oxidative Capability Assay Kit(A015-2)
-
 Total Anti-Oxidative Capability Assay Kit (A015-1)
-
 Superoxide Dismutase Assay Kit
-
 Fructose Assay Kit (A085)
-
 Citric Acid Assay Kit (A128 )
-
 Catalase Assay Kit
-
 Malondialdehyde Assay Kit
-
 Glutathione S-Transferase Assay Kit
-
 Microscale Reduced Glutathione assay kit
-
 Glutathione Reductase Activity Coefficient Assay Kit
-
 Angiotensin Converting Enzyme Kit
-
 Glutathione Peroxidase (GSH-PX) Assay Kit
-
 Cloud-Clone Multiplex assay kits