Mouse Model for Gallstone (GS) 

- UOM
- FOB US$ 250.00
- Quantity
Overview
Properties
- Product No.DSI549Mu01
- Organism SpeciesMus musculus (Mouse) Same name, Different species.
- ApplicationsDisease Model
Research use only - Downloadn/a
- Category
- Prototype SpeciesHuman
- SourceCholesterol gallstone (GCD) induced by lithogenous diet
- Model Animal StrainsC57BL/6 Mice(SPF), healthy, male, bodyweight:18~22g.
- Modeling GroupingRandomly divided into six group: Control group, Model group, Positive drug group and Test drug group (three doses) n=15.
- Modeling Period5w~8w
Sign into your account
Share a new citation as an author
Upload your experimental result
Review

Contact us
Please fill in the blank.
Modeling Method
1. C57BL/6 mice were randomly divided into 6 groups,raised in the SPF class animal room, the room to maintain a constant temperature (22℃±1℃) and 12 hours of alternating light and dark. Mice were allowed to drink water freely, and all mice were fed for a week with a normal diet (0.02% cholesterol).
2. At the end of the second week, the model group was fed with the feed of lithogenous diet (including 15% fat, 2% cholesterol and 1% cholic acid) for 4 weeks, and the blank control group was fed with common feed for 4 weeks.
3. After modeling, the general situation of mice was observed: the body weight and food intake were recorded every week, to observe the gloss of fur, activity and mental state of mice.
Model evaluation
1. After anesthesia, take the middle abdominal incision, recorded as stone, measuring the length and width of the gallbladder, collection of gallbladder bile, bile duct and bile collection device of PE pipe measurement, cut gallbladder tissues, liver (weighing), the initial segment of jejunum, inferior vena cava puncture blood.
2. The concentrations of cholesterol, phospholipids and bile acids in bile were determined by automatic biochemical analyzer. The content of automatic biochemical analyzer detected serum cholesterol, triglyceride, bile acids and alanine aminotransferase. The cholesterol concentration in the model group was much higher than that in the control group, the difference was statistically significant.
Pathological results
3. HE staining and saturated picric acid Sirius red staining for gallbladder tissue, light microscope and polarizing microscope to observe the histological changes and collagen deposition of the gallbladder wall.
4. Liver tissues were stained with oil red O, and the liver lipid deposition was observed under light microscope. Liver tissue HE staining and fat infiltration score.
Cytokines level
5. The expression of ABCB11, ABCG5, ABCG8 and abcb4 protein in liver tissue was detected by Western Blot method and the expression of npc111 protein in the jejunum mucosa.
Statistical analysis
SPSS software is used for statistical analysis, measurement data to mean ± standard deviation (x ±s), using t test and single factor analysis of variance for group comparison , P<0.05 indicates there was a significant difference, P<0.01 indicates there are very significant differences.
Giveaways
Increment services
-
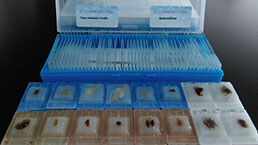 Tissue/Sections Customized Service
-
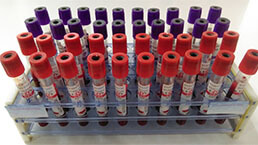 Serums Customized Service
-
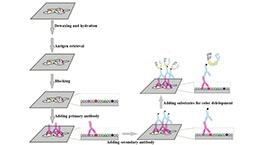 Immunohistochemistry (IHC) Experiment Service
-
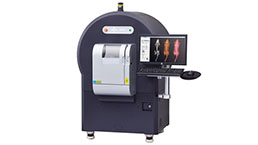 Small Animal Micro CT Imaging Experiment Service
-
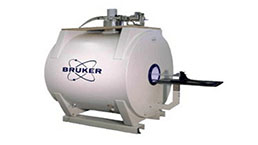 Small Animal MRI Imaging Experiment Service
-
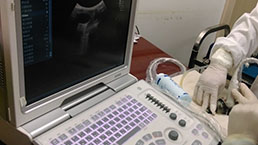 Small Animal Ultrasound Imaging Experiment Service
-
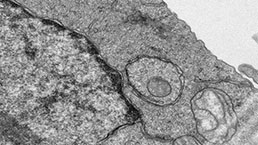 Transmission Electron Microscopy (TEM) Experiment Service
-
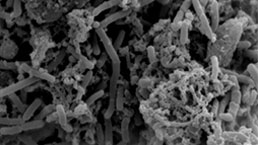 Scanning Electron Microscope (SEM) Experiment Service
-
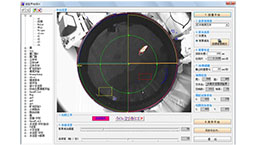 Learning and Memory Behavioral Experiment Service
-
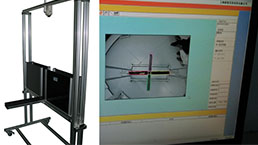 Anxiety and Depression Behavioral Experiment Service
-
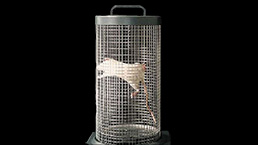 Drug Addiction Behavioral Experiment Service
-
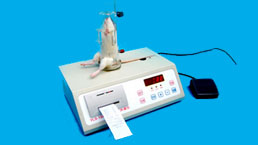 Pain Behavioral Experiment Service
-
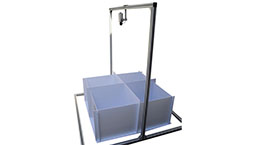 Neuropsychiatric Disorder Behavioral Experiment Service
-
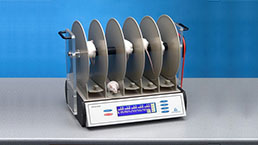 Fatigue Behavioral Experiment Service
-
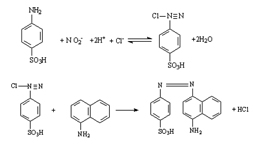 Nitric Oxide Assay Kit (A012)
-
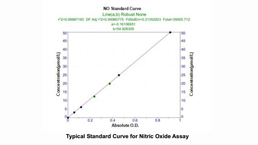 Nitric Oxide Assay Kit (A013-2)
-
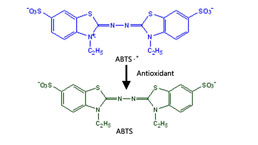 Total Anti-Oxidative Capability Assay Kit(A015-2)
-
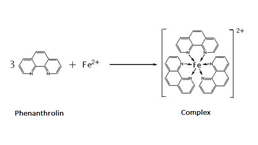 Total Anti-Oxidative Capability Assay Kit (A015-1)
-
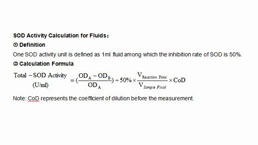 Superoxide Dismutase Assay Kit
-
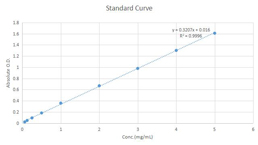 Fructose Assay Kit (A085)
-
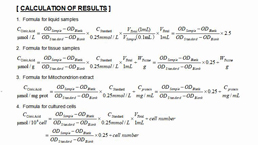 Citric Acid Assay Kit (A128 )
-
 Catalase Assay Kit
-
 Malondialdehyde Assay Kit
-
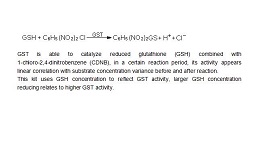 Glutathione S-Transferase Assay Kit
-
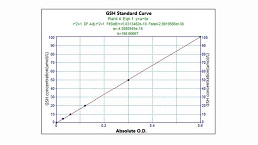 Microscale Reduced Glutathione assay kit
-
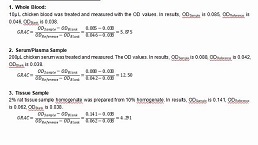 Glutathione Reductase Activity Coefficient Assay Kit
-
 Angiotensin Converting Enzyme Kit
-
 Glutathione Peroxidase (GSH-PX) Assay Kit
-
 Cloud-Clone Multiplex assay kits


