Mouse Model for Hepatitis ")

- UOM
- FOB US$ 120.00
- Quantity
Overview
Properties
- Product No.DSI536Mu01
- Organism SpeciesMus musculus (Mouse) Same name, Different species.
- ApplicationsConA-induced Hepatitis Model can used to evaluate the efficacy of drug for hepatitis.
Research use only - Downloadn/a
- Category
- Prototype SpeciesHuman
- SourceConA-induced Hepatitis
- Model Animal StrainsBalb/c mice (SPF level), male, week age:8w-10w, body weight:30g~35g
- Modeling GroupingRandomly divided into 6 groups: Control group, Model group, Positive drug group and Test drug group(three doses), 15 mice per group.
- Modeling Period6 hours
Sign into your account
Share a new citation as an author
Upload your experimental result
Review

Contact us
Please fill in the blank.
-
 Packages (Simulation)
-
 Packages (Simulation)
-
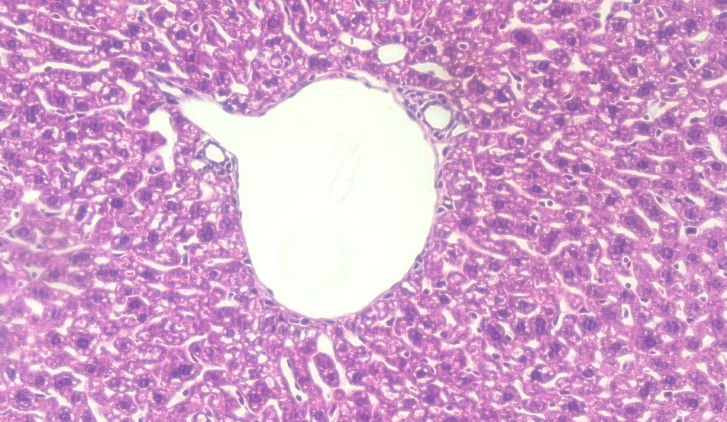 Fig. HE staining, Liver of control group mice, Liver cells show radioactive arrangement in central veins.
-
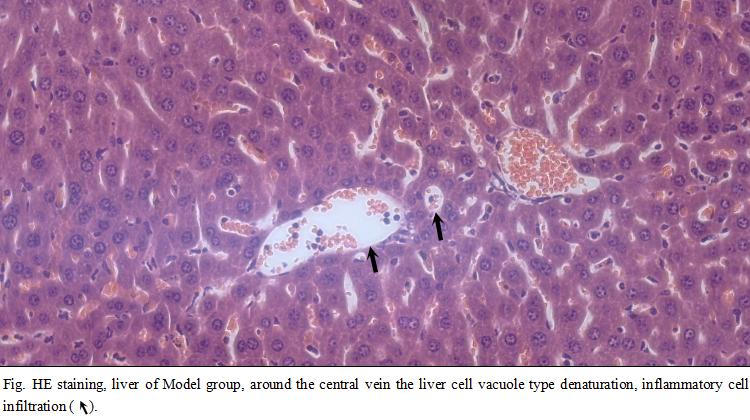 Fig. HE staining, liver of Model group.
-
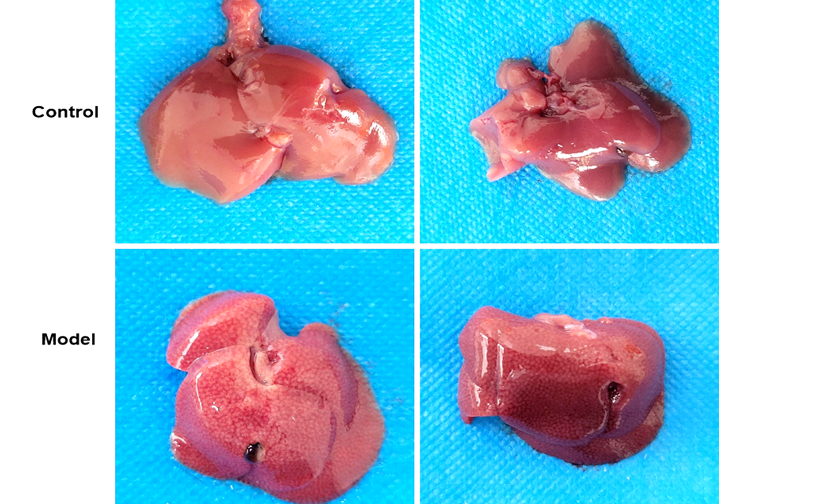 Fig. The livers of modeling mice
-
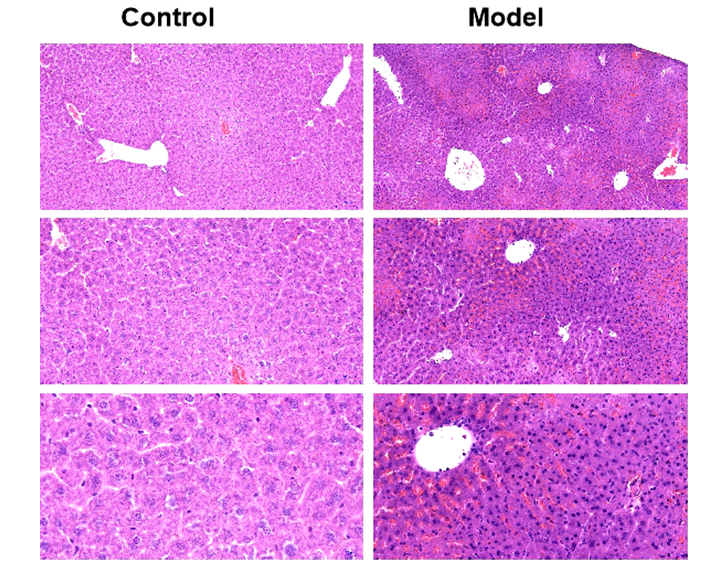 Fig. HE staining of livers
-
 ISO9001: 2008, ISO13485: 2003 Registered
Modeling Method
ConA dissolved in 0.01 mol/L phosphate buffered saline (PBS), with a concentration of 4mg/ml, with the dose of 20mg/kg from mice tail vein injection, 6h after injection, mice are sacrificed. At the same time, for the control group mice, inject PBS. All mice are free feeding and drinking water.
Model evaluation
1.Assay for ALT, AST, MPO
Pick eyeball to take blood at 6hrs after modeling,3000r/min, 4℃,10mins, collect the upper serum, stored at -80℃. Compared with the control group, the serum Alanine aminotransferase(ALT), aspartate aminotransferase (AST) and Myeloperoxidase (MPO) are significantly increased in the model group.
Pathological results
Take a liver lobe, with 4% poly formaldehyde solution fixed, conventional paraffin embedded sections, observation of pathological changes. In the control group, the structure of the hepatic lobe is complete, and the hepatic cells are centered in the central vein. In model group, hepatic cell cord arranged in disorder, liver sinus congestion is a common, hepatic lobule most liver cell swelling, fibrous septa formation, spotty necrosis and focal necrosis. A large number of neutrophils, infiltration of lymphocytes and mononuclear cells, extensive hepatocyte addicted to acid degeneration, vacuolar degeneration and fatty change can be observed in the focal necrosis.
Cytokines level
After the liver injury, the expression of TNFα, IFNγ, IL-2, IL-6, ICAM1 and other cytokines in serum is significantly increased, which could be detected by ELISA method.
Statistical analysis
SPSS software is used for statistical analysis, measurement data to mean ± standard deviation (x ±s), using t test and single factor analysis of variance for group comparison , P<0.05 indicates there was a significant difference, P<0.01 indicates there are very significant differences.
Giveaways

Increment services
-
 Tissue/Sections Customized Service
-
 Serums Customized Service
-
 Immunohistochemistry (IHC) Experiment Service
-
 Small Animal In Vivo Imaging Experiment Service
-
 Small Animal Micro CT Imaging Experiment Service
-
 Small Animal MRI Imaging Experiment Service
-
 Small Animal Ultrasound Imaging Experiment Service
-
 Transmission Electron Microscopy (TEM) Experiment Service
-
 Scanning Electron Microscope (SEM) Experiment Service
-
 Learning and Memory Behavioral Experiment Service
-
 Anxiety and Depression Behavioral Experiment Service
-
 Drug Addiction Behavioral Experiment Service
-
 Pain Behavioral Experiment Service
-
 Neuropsychiatric Disorder Behavioral Experiment Service
-
 Fatigue Behavioral Experiment Service
-
 Nitric Oxide Assay Kit (A012)
-
 Nitric Oxide Assay Kit (A013-2)
-
 Total Anti-Oxidative Capability Assay Kit(A015-2)
-
 Total Anti-Oxidative Capability Assay Kit (A015-1)
-
 Superoxide Dismutase Assay Kit
-
 Fructose Assay Kit (A085)
-
 Citric Acid Assay Kit (A128 )
-
 Catalase Assay Kit
-
 Malondialdehyde Assay Kit
-
 Glutathione S-Transferase Assay Kit
-
 Microscale Reduced Glutathione assay kit
-
 Glutathione Reductase Activity Coefficient Assay Kit
-
 Angiotensin Converting Enzyme Kit
-
 Glutathione Peroxidase (GSH-PX) Assay Kit
-
 Cloud-Clone Multiplex assay kits