Mouse Model for Peritoneal Fibrosis (PF) ")

PF; Peritoneal Fibrosis
- UOM
- FOB US$ 240.00
- Quantity
Overview
Properties
- Product No.DSI819Mu01
- Organism SpeciesMus musculus (Mouse) Same name, Different species.
- ApplicationsUsed to study the process and pharmacodynamics of peritoneal fibrosis
Research use only - Downloadn/a
- CategoryDigestive systemUrinary systemReproductive system
- Prototype SpeciesHuman
- SourceIntraperitoneal injection(I.P) of high glucose dialysate
- Model Animal StrainsKM mice (SPF), healthy, male, 6~8 weeks
- Modeling GroupingRandomly divided into six group: Control group, Model group, Positive drug group and Test drug group
- Modeling Period4w
Sign into your account
Share a new citation as an author
Upload your experimental result
Review

Contact us
Please fill in the blank.
-
 Packages (Simulation)
-
 Packages (Simulation)
-
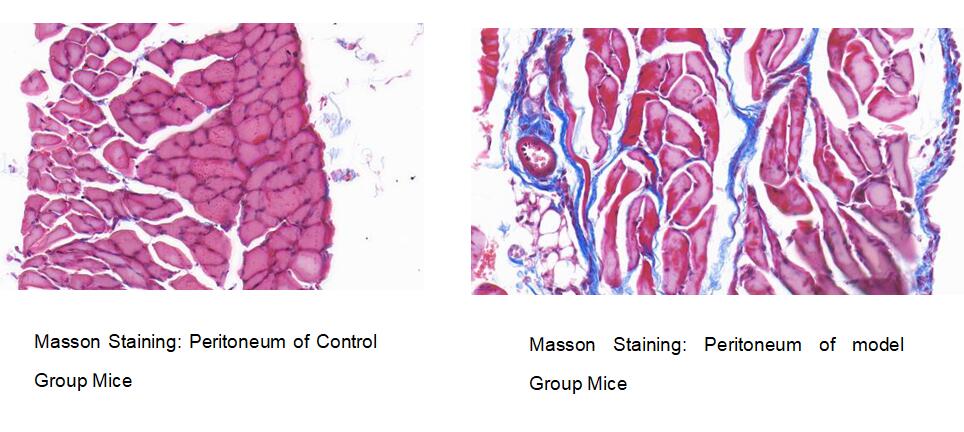 Fig. Masson Staining of Peritoneum in Control and Model Group Mice
-
 ISO9001: 2008, ISO13485: 2003 Registered
Modeling Method
1.Mice were intraperitoneally injected with 4.25% high glucose dialysate (100ml/kg) and LPS (0.1mg/kg) once a day for four weeks.
2.Measure the peritoneal function and take tissue from the parietal peritoneum and visceral peritoneum (mesentery) for relevant indicators.
Model evaluation
1. Observe the changes in peritoneal thickness of experimental animals in each group using Masson staining. Compared with the normal control group, Masson staining showes that the model group had significantly thickened peritoneum, increased extracellular matrix, increased collagen fibers, and significant changes in peritoneal fibrosis.
Pathological results
2. Western blot and Q-PCR detection of fibronectin (FN) and smooth muscle protein( α- SMA), E. cadherin, expression of type I collagen (Col I).
Cytokines level
Statistical analysis
SPSS software is used for statistical analysis, measurement data to mean ± standard deviation (x ±s), using t test and single factor analysis of variance for group comparison , P<0.05 indicates there was a significant difference, P<0.01 indicates there are very significant differences.
Giveaways

Increment services
-
 Tissue/Sections Customized Service
-
 Serums Customized Service
-
 Immunohistochemistry (IHC) Experiment Service
-
 Small Animal In Vivo Imaging Experiment Service
-
 Small Animal Micro CT Imaging Experiment Service
-
 Small Animal MRI Imaging Experiment Service
-
 Small Animal Ultrasound Imaging Experiment Service
-
 Transmission Electron Microscopy (TEM) Experiment Service
-
 Scanning Electron Microscope (SEM) Experiment Service
-
 Learning and Memory Behavioral Experiment Service
-
 Anxiety and Depression Behavioral Experiment Service
-
 Drug Addiction Behavioral Experiment Service
-
 Pain Behavioral Experiment Service
-
 Neuropsychiatric Disorder Behavioral Experiment Service
-
 Fatigue Behavioral Experiment Service
-
 Nitric Oxide Assay Kit (A012)
-
 Nitric Oxide Assay Kit (A013-2)
-
 Total Anti-Oxidative Capability Assay Kit(A015-2)
-
 Total Anti-Oxidative Capability Assay Kit (A015-1)
-
 Superoxide Dismutase Assay Kit
-
 Fructose Assay Kit (A085)
-
 Citric Acid Assay Kit (A128 )
-
 Catalase Assay Kit
-
 Malondialdehyde Assay Kit
-
 Glutathione S-Transferase Assay Kit
-
 Microscale Reduced Glutathione assay kit
-
 Glutathione Reductase Activity Coefficient Assay Kit
-
 Angiotensin Converting Enzyme Kit
-
 Glutathione Peroxidase (GSH-PX) Assay Kit
-
 Cloud-Clone Multiplex assay kits