Rabbit Model for Liver Cirrhosis (LC) ")

Cirrhosis; Hepatic cirrhosis
- UOM
- FOB US$ 400.00
- Quantity
Overview
Properties
- Product No.DSI554Rb06
- Organism SpeciesOryctolagus cuniculus (Rabbit) Same name, Different species.
- Applicationsn/a
Research use only - Downloadn/a
- Category
- Prototype SpeciesHuman
- Sourceinduced by dile duct ligation
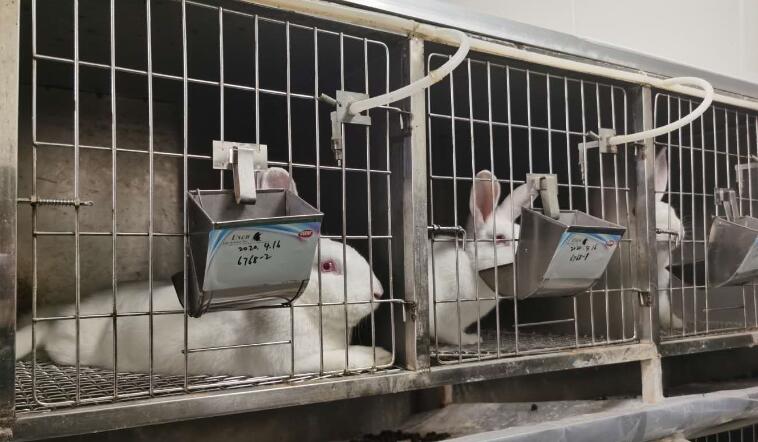
- Model Animal StrainsBig ears white rabbit, healthy, male and female, weight 1.5-2.5kg.
- Modeling GroupingRandomly divided into six group: Control group, Model group, Positive drug group and Test drug group.
- Modeling Period14-16 weeks
Sign into your account
Share a new citation as an author
Upload your experimental result
Review

Contact us
Please fill in the blank.
-
 Packages (Simulation)
-
 Packages (Simulation)
-
 Picture
-
 ISO9001: 2008, ISO13485: 2003 Registered
Modeling Method
The common bile duct was isolated from duodenum about 3cm from gastric pylorus under anesthesia. After the common bile duct was dissociated, a steel needle with a diameter of about 1mm was taken and placed horizontally in the extrahepatic bile duct for ligation with 6-0 silk wire. After ligation, the steel needle was removed, hemostasis was stopped, sutures were made, and antibiotic injection nursing was given.
The surviving rabbits were sacrificed 14 weeks after ligation to observe the changes of biliary system. Before ligation and after ligation, 1.5mL blood samples were taken from the central meridian ear artery of rabbits at 1, 2, 4 and 11 weeks to measure serum alanine aminotransferase (ALT), aspartate aminotransferase (AST), total bilirubin (TBIL), direct bilirubin (DBIL), total protein (TP) and albumin (ALB).
The common bile duct was dilated to different degrees from stenosis, and some showed beaded dilation, but there was no inclusion of gallstone deposition, and the degree of liver fibrosis was severe. In the first week after surgery, ALT, AST, TBIL and DBIL were significantly increased; in the second week, ALT, AST, TP and ALB were decreased, and TBIL and DBIL were normal.
Model evaluation
Pathological results
Cytokines level
Statistical analysis
SPSS software is used for statistical analysis, measurement data to mean ± standard deviation (x ±s), using t test and single factor analysis of variance for group comparison , P<0.05 indicates there was a significant difference, P<0.01 indicates there are very significant differences.
Giveaways

Increment services
-
 Tissue/Sections Customized Service
-
 Serums Customized Service
-
 Immunohistochemistry (IHC) Experiment Service
-
 Small Animal In Vivo Imaging Experiment Service
-
 Small Animal Micro CT Imaging Experiment Service
-
 Small Animal MRI Imaging Experiment Service
-
 Small Animal Ultrasound Imaging Experiment Service
-
 Transmission Electron Microscopy (TEM) Experiment Service
-
 Scanning Electron Microscope (SEM) Experiment Service
-
 Learning and Memory Behavioral Experiment Service
-
 Anxiety and Depression Behavioral Experiment Service
-
 Drug Addiction Behavioral Experiment Service
-
 Pain Behavioral Experiment Service
-
 Neuropsychiatric Disorder Behavioral Experiment Service
-
 Fatigue Behavioral Experiment Service
-
 Nitric Oxide Assay Kit (A012)
-
 Nitric Oxide Assay Kit (A013-2)
-
 Total Anti-Oxidative Capability Assay Kit(A015-2)
-
 Total Anti-Oxidative Capability Assay Kit (A015-1)
-
 Superoxide Dismutase Assay Kit
-
 Fructose Assay Kit (A085)
-
 Citric Acid Assay Kit (A128 )
-
 Catalase Assay Kit
-
 Malondialdehyde Assay Kit
-
 Glutathione S-Transferase Assay Kit
-
 Microscale Reduced Glutathione assay kit
-
 Glutathione Reductase Activity Coefficient Assay Kit
-
 Angiotensin Converting Enzyme Kit
-
 Glutathione Peroxidase (GSH-PX) Assay Kit
-
 Cloud-Clone Multiplex assay kits