Rat Model for Arrhythmia 

Cardiac Arrhythmia
- UOM
- FOB US$
- Quantity
Overview
Properties
- Product No.DSI506Ra05
- Organism SpeciesRattus norvegicus (Rat) Same name, Different species.
- Applicationsn/a
Research use only - Downloadn/a
- Category
- Prototype SpeciesHuman
- SourceInduced by myocardial ischemia/reperfusion
- Model Animal StrainsWistar Rats(SPF), healthy, male, body weight 250-450g.
- Modeling GroupingRandomly divided into six group: Control group, Model group, Positive drug group and Test drug group(low,medium,high).
- Modeling Periodn/a
Sign into your account
Share a new citation as an author
Upload your experimental result
Review

Contact us
Please fill in the blank.
Modeling Method
Use male rat with body weight of 250-450g, intraperitoneously anesthetized with 25% Uralan at a dose of 1.2 to 5g/kg. Fix the animal supine, piercing the needle electrode into the rat limbs subcutaneous electrocardiogram and ECG oscilloscope, Record a normal II lead ECG. Cut the skin at the middle of the neck, separate trachea for tracheal intubation, connect the artificial respirator, respiratory ratio is 1:2, respiratory rate is 60 times/min, tidal volume of 60ml/kg. Open chest between the 3rd and 4th rib, exposure to the heart and cut the pericardium, pierce the needle at the beginning of 2 mm of heart left anterior descending coronary artery and set a No. 1 silk, after 10min stability, then ligation of a 1cm long, 3 mm diameter plastic hose and arteries. Then start recording ECG every minute, continuously record 30 mins, and cut the thread along the plastic hose, make it reperfusion. Record an electrocardiogram every minute, continuous record 40min and observe the occurrence of arrhythmia. After recovery of coronary perfusion, the emergence of arrhythmia occur immediately, mainly for ventricular premature beats, ventricular tachycardia, ventricular fibrillation and atrioventricular block. The highest incidence occurred within 15 mins after reperfusion.
Model evaluation
Pathological results
Cytokines level
Statistical analysis
SPSS software is used for statistical analysis, measurement data to mean ± standard deviation (x ±s), using t test and single factor analysis of variance for group comparison , P<0.05 indicates there was a significant difference, P<0.01 indicates there are very significant differences.
Giveaways
Increment services
-
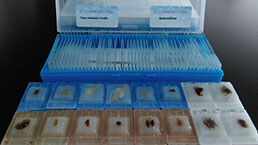 Tissue/Sections Customized Service
-
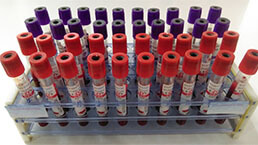 Serums Customized Service
-
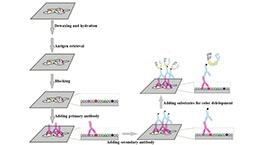 Immunohistochemistry (IHC) Experiment Service
-
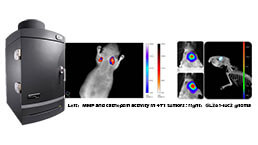 Small Animal In Vivo Imaging Experiment Service
-
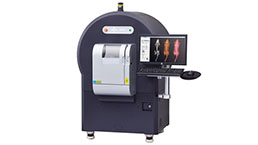 Small Animal Micro CT Imaging Experiment Service
-
 Small Animal MRI Imaging Experiment Service
-
 Small Animal Ultrasound Imaging Experiment Service
-
 Transmission Electron Microscopy (TEM) Experiment Service
-
 Scanning Electron Microscope (SEM) Experiment Service
-
 Learning and Memory Behavioral Experiment Service
-
 Anxiety and Depression Behavioral Experiment Service
-
 Drug Addiction Behavioral Experiment Service
-
 Pain Behavioral Experiment Service
-
 Neuropsychiatric Disorder Behavioral Experiment Service
-
 Fatigue Behavioral Experiment Service
-
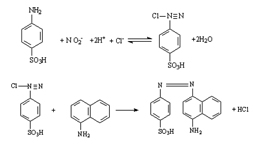 Nitric Oxide Assay Kit (A012)
-
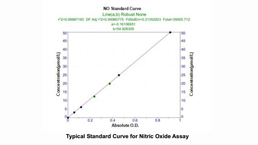 Nitric Oxide Assay Kit (A013-2)
-
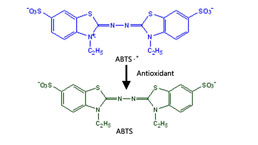 Total Anti-Oxidative Capability Assay Kit(A015-2)
-
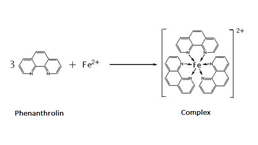 Total Anti-Oxidative Capability Assay Kit (A015-1)
-
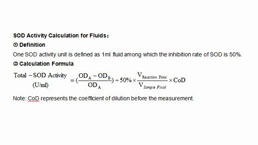 Superoxide Dismutase Assay Kit
-
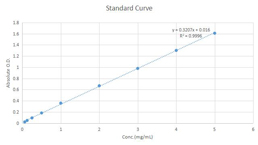 Fructose Assay Kit (A085)
-
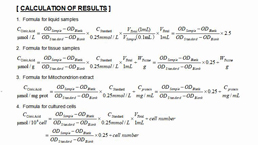 Citric Acid Assay Kit (A128 )
-
 Catalase Assay Kit
-
 Malondialdehyde Assay Kit
-
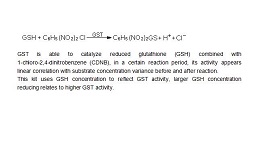 Glutathione S-Transferase Assay Kit
-
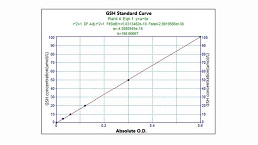 Microscale Reduced Glutathione assay kit
-
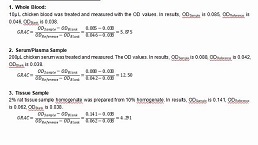 Glutathione Reductase Activity Coefficient Assay Kit
-
 Angiotensin Converting Enzyme Kit
-
 Glutathione Peroxidase (GSH-PX) Assay Kit
-
 Cloud-Clone Multiplex assay kits


