Rat Model for Venous Thromboembolism (VTE) ")

VTE
- UOM
- FOB US$ 200.00
- Quantity
Overview
Properties
- Product No.DSI539Ra01
- Organism SpeciesRattus norvegicus (Rat) Same name, Different species.
- ApplicationsDisease Model
Research use only - Downloadn/a
- Category
- Prototype SpeciesHuman
- SourceDeep Venous Thromboembolism induce PE
- Model Animal StrainsSD Rats(SPF class), healthy, male, body weight 180g~200g
- Modeling GroupingRandomly divided into six group: Control group, Model group, Positive drug group and Test drug group (three doses)
- Modeling Period1~14d
Sign into your account
Share a new citation as an author
Upload your experimental result
Review

Contact us
Please fill in the blank.
-
 Packages (Simulation)
-
 Packages (Simulation)
-
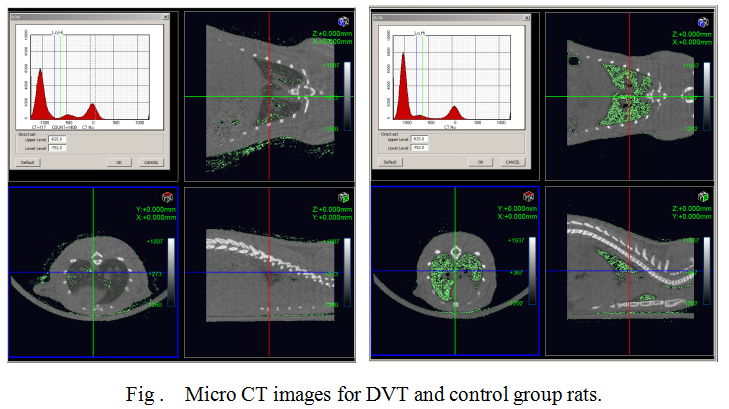 DVT modeling,rat lung density is significantly higher than that of the control group
-
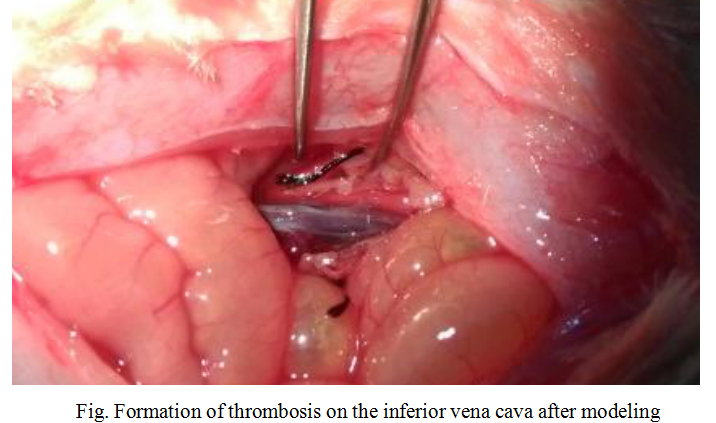 Fig. Formation of thrombosis on the inferior vena cava after modeling
-
 ISO9001: 2008, ISO13485: 2003 Registered
Modeling Method
1. Fasting for one night before the operation, free drinking water.
2. Weight the rats and anesthetized by intraperitoneal injection of chloral hydrate (15%) 350mg/kg, shaving and use iodine and alcohol to wipe operation area.
3. Cut the abdominal cavity,from the linea alba abdominis, blunt separation of inferior vena cava, with 5-0 suture in renal vein beneath the ligation of the inferior vena cava and the main branch, then 5-0 suture inner, 3-0 suture outer, rats are placed on a heating pad maintain rectal temperature in 37 ±0.5℃.
4. Free drinking water, normal feeding after the rats wake up.
Model evaluation
1. Lower limb swelling observation: 1d after operation, observe whether the swelling of the lower limbs of rats.
2. 7d after operation, the lungs are detected by Micro CT to observe the occurrence and severity of pulmonary embolism.
The DVT modeling,rat lung density is significantly higher than that of the control group, suggesting that DVT rat lungs exist significant edema, thrombosis.
Pathological results
Cytokines level
The expression of vWF, ICAM-1 and other cytokines in serum is significantly increased, which could be detected by ELISA method.
Statistical analysis
SPSS software is used for statistical analysis, measurement data to mean ± standard deviation (x ±s), using t test and single factor analysis of variance for group comparison , P<0.05 indicates there was a significant difference, P<0.01 indicates there are very significant differences.
Giveaways

Increment services
-
 Tissue/Sections Customized Service
-
 Serums Customized Service
-
 Immunohistochemistry (IHC) Experiment Service
-
 Small Animal In Vivo Imaging Experiment Service
-
 Small Animal Micro CT Imaging Experiment Service
-
 Small Animal MRI Imaging Experiment Service
-
 Small Animal Ultrasound Imaging Experiment Service
-
 Transmission Electron Microscopy (TEM) Experiment Service
-
 Scanning Electron Microscope (SEM) Experiment Service
-
 Learning and Memory Behavioral Experiment Service
-
 Anxiety and Depression Behavioral Experiment Service
-
 Drug Addiction Behavioral Experiment Service
-
 Pain Behavioral Experiment Service
-
 Neuropsychiatric Disorder Behavioral Experiment Service
-
 Fatigue Behavioral Experiment Service
-
 Nitric Oxide Assay Kit (A012)
-
 Nitric Oxide Assay Kit (A013-2)
-
 Total Anti-Oxidative Capability Assay Kit(A015-2)
-
 Total Anti-Oxidative Capability Assay Kit (A015-1)
-
 Superoxide Dismutase Assay Kit
-
 Fructose Assay Kit (A085)
-
 Citric Acid Assay Kit (A128 )
-
 Catalase Assay Kit
-
 Malondialdehyde Assay Kit
-
 Glutathione S-Transferase Assay Kit
-
 Microscale Reduced Glutathione assay kit
-
 Glutathione Reductase Activity Coefficient Assay Kit
-
 Angiotensin Converting Enzyme Kit
-
 Glutathione Peroxidase (GSH-PX) Assay Kit
-
 Cloud-Clone Multiplex assay kits