Mouse Model for Acute Pancreatitis (AP) ")

- UOM
- FOB US$ 200.00
- Quantity
Overview
Properties
- Product No.DSI555Mu01
- Organism SpeciesMus musculus (Mouse) Same name, Different species.
- ApplicationsDisease Model
Research use only - Downloadn/a
- Category
- Prototype SpeciesHuman
- SourceAcute severe pancreatitis induced by Cerulein
- Model Animal StrainsC57BL/6 Mice(SPF), healthy, male, age: 8~10weeks, body weight:20g~25g.
- Modeling GroupingRandomly divided into six group: Control group, Model group, Positive drug group and Test drug group.
- Modeling Period4-6 weeks
Sign into your account
Share a new citation as an author
Upload your experimental result
Review

Contact us
Please fill in the blank.
-
 Packages (Simulation)
-
 Packages (Simulation)
-
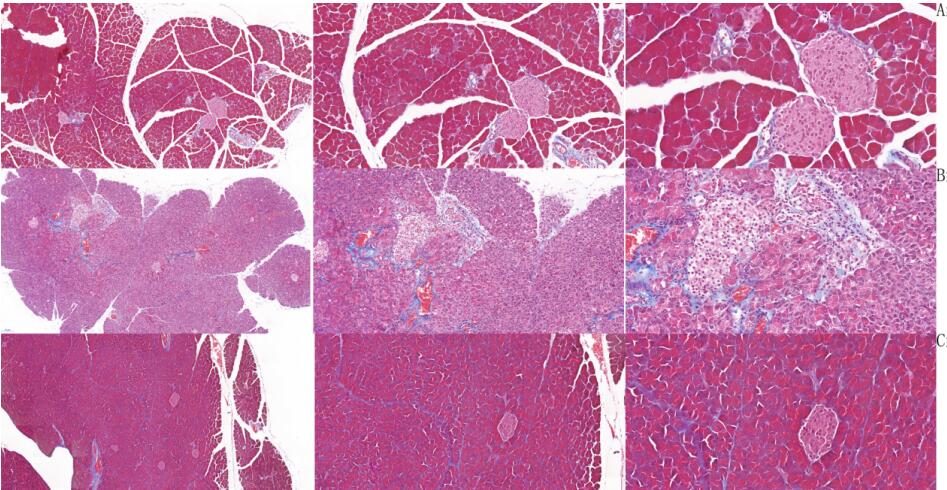 Fig. Masson staining for pancreas of mouse Acute Pancreatitis
-
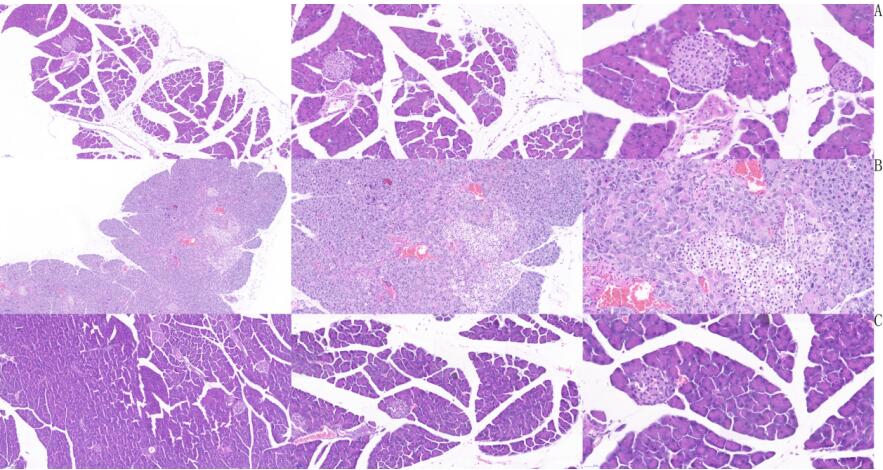 Fig. HE staining for pancreas of mouse Acute Pancreatitis
-
 ISO9001: 2008, ISO13485: 2003 Registered
Modeling Method
Group A: pancreatitis model with mild symptoms:
Intraperitoneally, one day a week, Cerulein was injected 50 µg/kg (1.25µg/ mouse) 7 times, with an interval of 1 hour. A total of 6 weeks of injection.
Group B: severe pancreatitis model:
Weekly: 33% ethanol 150ul, 3g/kg, intraperitoneal injection twice from 1d to 3d. Two abdominal intervals of 12 hours. On the 4th day, Cerulein was intraperitoneally injected for 7 times, 50 µg/kg (1.25µg/ mouse) at an interval of 1 hour.
150ul 33% ethanol was intraperitoneally injected twice at 3g/kg (75mg per animal) from 5 d to 7 d. Two abdominal intervals of 12 hours.
The above modeling lasted for 6 weeks.
Group C: Normal group.
Model evaluation
At the 6th week of modeling, the animals in each group were sacrificed and fresh pancreatic tissues were collected. Fixed to 4% paraformaldehyde for more than 24h. Remove the tissue from the fixative solution and smooth the tissue of the target part with a scalpel in the ventilation cabinet. Put the cut tissue and the corresponding label in the dehydration box, and then dehydrate, fix, encapsulate and slice.
HE and Masson staining were performed to determine the degree of pancreatic fibrosis.
Pathological results
HE staining results: Group A was mild pancreatitis, group B was severe pancreatitis, and group C was normal. Compared with group C, group B had adipose vacuolation degeneration of islet cells, loose edema of some acinar cells, and eagle-eyed giant cell lesion of some acinar cells. Compared with group C, group A had no obvious islet lesions and vascular hyperplasia. Not as severe as group B.
Masson staining results: Group A was mild pancreatitis group, group B was severe pancreatitis group and group C was normal group. Compared with group C, pancreatic vascular perivascular and islet fibrosis, lipoid vacuole degeneration of islet cells, and amyloidosis of acinar cells also occurred in group B. Compared with group C, only peripheral vascular fibrosis was found in group A, and pancreatic islet and acinar cells had no obvious lesions.
Cytokines level
The acute pancreatitis model can be evaluated by the combined detection of serum para-amylase, urinary amylase, blood lipase, glutamic-pyruvate aminotransferase, serum creatinine and lactate dehydrogenase.
Statistical analysis
SPSS software is used for statistical analysis, measurement data to mean ± standard deviation (x ±s), using t test and single factor analysis of variance for group comparison , P<0.05 indicates there was a significant difference, P<0.01 indicates there are very significant differences.
Giveaways

Increment services
-
 Tissue/Sections Customized Service
-
 Serums Customized Service
-
 Immunohistochemistry (IHC) Experiment Service
-
 Small Animal In Vivo Imaging Experiment Service
-
 Small Animal Micro CT Imaging Experiment Service
-
 Small Animal MRI Imaging Experiment Service
-
 Small Animal Ultrasound Imaging Experiment Service
-
 Transmission Electron Microscopy (TEM) Experiment Service
-
 Scanning Electron Microscope (SEM) Experiment Service
-
 Learning and Memory Behavioral Experiment Service
-
 Anxiety and Depression Behavioral Experiment Service
-
 Drug Addiction Behavioral Experiment Service
-
 Pain Behavioral Experiment Service
-
 Neuropsychiatric Disorder Behavioral Experiment Service
-
 Fatigue Behavioral Experiment Service
-
 Nitric Oxide Assay Kit (A012)
-
 Nitric Oxide Assay Kit (A013-2)
-
 Total Anti-Oxidative Capability Assay Kit(A015-2)
-
 Total Anti-Oxidative Capability Assay Kit (A015-1)
-
 Superoxide Dismutase Assay Kit
-
 Fructose Assay Kit (A085)
-
 Citric Acid Assay Kit (A128 )
-
 Catalase Assay Kit
-
 Malondialdehyde Assay Kit
-
 Glutathione S-Transferase Assay Kit
-
 Microscale Reduced Glutathione assay kit
-
 Glutathione Reductase Activity Coefficient Assay Kit
-
 Angiotensin Converting Enzyme Kit
-
 Glutathione Peroxidase (GSH-PX) Assay Kit
-
 Cloud-Clone Multiplex assay kits