Mouse Model for Allergic Encephalomyelitis (AE) ")

Experimental allergic encephalomyelitis, EAE
- UOM
- FOB US$ 200.00
- Quantity
Overview
Properties
- Product No.DSI694Mu01
- Organism SpeciesMus musculus (Mouse) Same name, Different species.
- ApplicationsUsed for therapeutic effect research and immunological mechanism of drugs on mice with autoimmune encephalomyelitis
Research use only - Downloadn/a
- CategoryCerebral and nervous systems
- Prototype SpeciesHuman
- SourceInduced by Injection of MOG35~55 peptide
- Model Animal StrainsC57BL/6 Mice(SPF), healthy, male, age: 4~6 weeks, body weight:18g~20g.
- Modeling GroupingRandomly divided into six group: Control group, Model group, Positive drug group and Test drug group.
- Modeling Period4-6 weeks
Sign into your account
Share a new citation as an author
Upload your experimental result
Review

Contact us
Please fill in the blank.
-
 Packages (Simulation)
-
 Packages (Simulation)
-
 Picture
-
 ISO9001: 2008, ISO13485: 2003 Registered
Modeling Method
Multiple sclerosis (MS) is an inflammatory demyelinating disease of the central nervous system with high rates of relapse, persistence and disability. It is difficult to obtain MS specimens, which limits the research on this disease. Therefore, establishing the corresponding animal model is an important way to study the pathological process and pathogenesis of MS.
Model induced MICE in EAE group: the antigen myelin oligodectin glycoprotein (MOG35-55) polypeptide was diluted to 300ug/50ul, and the same amount of complete Adjuvant was added at the rate of 1:1. After full emulsification, the mice were injected subcutaneously at the rate of 100ul per mouse in axilla. On the day of immunization and 24h after immunization, mice were injected 100ul PBS containing 200ng pertussis toxin through tail vein. PBS control group was induced with PBS instead of antigen, same as EAE group.
Model evaluation
1. Neurological function score:
The body weight of the mice was measured from the day of immune induction, and the neurological function was scored by double-blind method 32 days after immunization. The specific scoring criteria were as follows:
Level 0, no clinical manifestation;
Level 1, spiritually depressed, tail weak;
Level 2, walking gait abnormality, double leg weakness;
Level 3, double paralyzed hind legs;
Level 4, the double either one or both hind legs paralyzed with forelimbs collapse;
Level 5, near death or dead. Recurrence was defined as a recurrence with a higher clinical score than before after recovery from the initial episode, or the same score continued for more than 3 days.
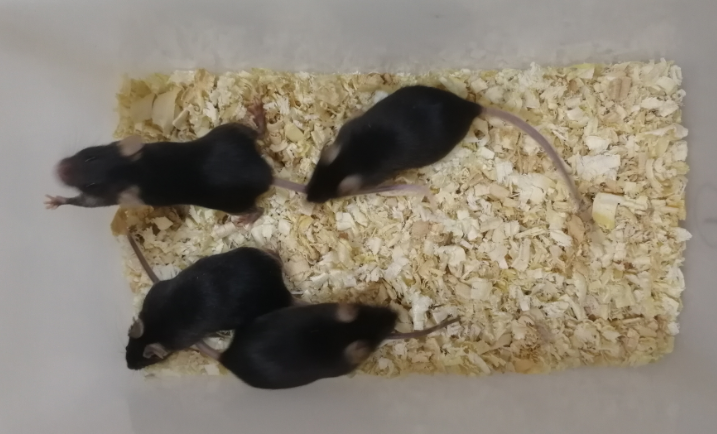
2. Clinical manifestations
Acute onset in mice was induced at 12±3 days, peaked within 16±2 days, and then gradually recovered to mild weakness or stiffness in the tail. The severity score of the onset in mice was 3.2±0.6.
Pathological results
Tissue sampling and pathological analysis At the peak of EAE model, the mice were anesthetized by intraperitoneal injection of chloral hydrate, and their brain and spinal cord were taken, fixed in 4% paraformaldehyde, embedded in paraffin, and observed by HE and solid green staining.
There were inflammatory cell infiltrates in the parenchyma of both brain and spinal cord, but the distribution of the lesions was mainly cervical and lumbar enlargement of the spinal cord, which was characterized by a large number of lymphocytes and neutrophils. The infiltrates extended from outside to inside along the capsule and small blood vessels, and vascular sheath formation was observed around small blood vessels. Solid green staining showed that there were lamellar myelin demyelination areas of different sizes in the inflammatory infiltrated areas of the spinal cord white matter, and myelin fibers were loose and a large number of vacuolates were formed. There were no obvious abnormal changes in brain and spinal cord in PBS control group and normal control group.
Cytokines level
Statistical analysis
SPSS software is used for statistical analysis, measurement data to mean ± standard deviation (x ±s), using t test and single factor analysis of variance for group comparison , P<0.05 indicates there was a significant difference, P<0.01 indicates there are very significant differences.
Giveaways

Increment services
-
 Tissue/Sections Customized Service
-
 Serums Customized Service
-
 Immunohistochemistry (IHC) Experiment Service
-
 Small Animal In Vivo Imaging Experiment Service
-
 Small Animal Micro CT Imaging Experiment Service
-
 Small Animal MRI Imaging Experiment Service
-
 Small Animal Ultrasound Imaging Experiment Service
-
 Transmission Electron Microscopy (TEM) Experiment Service
-
 Scanning Electron Microscope (SEM) Experiment Service
-
 Learning and Memory Behavioral Experiment Service
-
 Anxiety and Depression Behavioral Experiment Service
-
 Drug Addiction Behavioral Experiment Service
-
 Pain Behavioral Experiment Service
-
 Neuropsychiatric Disorder Behavioral Experiment Service
-
 Fatigue Behavioral Experiment Service
-
 Nitric Oxide Assay Kit (A012)
-
 Nitric Oxide Assay Kit (A013-2)
-
 Total Anti-Oxidative Capability Assay Kit(A015-2)
-
 Total Anti-Oxidative Capability Assay Kit (A015-1)
-
 Superoxide Dismutase Assay Kit
-
 Fructose Assay Kit (A085)
-
 Citric Acid Assay Kit (A128 )
-
 Catalase Assay Kit
-
 Malondialdehyde Assay Kit
-
 Glutathione S-Transferase Assay Kit
-
 Microscale Reduced Glutathione assay kit
-
 Glutathione Reductase Activity Coefficient Assay Kit
-
 Angiotensin Converting Enzyme Kit
-
 Glutathione Peroxidase (GSH-PX) Assay Kit
-
 Cloud-Clone Multiplex assay kits