Mouse Model for Aplastic Anemia (AA) 

- UOM
- FOB US$
- Quantity
Overview
Properties
- Product No.DSI675Mu03
- Organism SpeciesMus musculus (Mouse) Same name, Different species.
- Applicationsn/a
Research use only - Downloadn/a
- CategoryHemolymphatic system
- Prototype SpeciesHuman
- SourceInduced by immune-mediated
- Model Animal StrainsBalb/c Mice(SPF), healthy, male, age: 8~10weeks, body weight:30g~35g.
- Modeling GroupingRandomly divided into six group: Control group, Model group, Positive drug group and Test drug group.
- Modeling Period4-6 weeks
Sign into your account
Share a new citation as an author
Upload your experimental result
Review
Contact us
Please fill in the blank.
Modeling Method
"Weight of 16-20 g, the age of 8-12 weeks BALB/c mice, as the receptor; 8-10 weeks of DBA/2 mice, as the donor. For both kinds of mice,there are no restriction of gender. Take DBA/2 mice and cervical dislocation execute, use 95% alcohol for immersion disinfection for 5 min, remove the thymus,axillary and inguinal lymph nodes with sterile method. Add RPMI-1640 culture, remove the blood and the surface adhesion of connective tissue. Cut tissues repeatly until they become pasty
.Then gently lapping with 200 mesh nylon mesh filter, making it the single cell suspension. Count and make 1 x10e9/L concentration, the thymus cells: lymphocytes proportion is 1:2. Drop 1, trypan blue drops on the slides, identification of cell activity should be above 95%. Make the BALB/c mice irradiation by gamma 6.0 Gy total body for 3 min.Within 1- 4 hours after irradiation with lethal dose,immediately inject above suspension through mice tail vein with the dose of 0.2 ml for one mouse. These make aplastic anemia animal models. "
Model evaluation
Pathological results
Cytokines level
Statistical analysis
SPSS software is used for statistical analysis, measurement data to mean ± standard deviation (x ±s), using t test and single factor analysis of variance for group comparison , P<0.05 indicates there was a significant difference, P<0.01 indicates there are very significant differences.
Giveaways
Increment services
-
 Tissue/Sections Customized Service
-
 Serums Customized Service
-
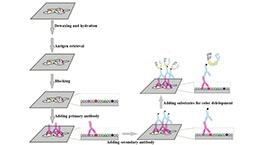 Immunohistochemistry (IHC) Experiment Service
-
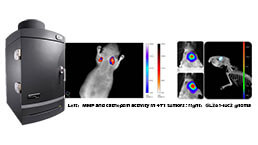 Small Animal In Vivo Imaging Experiment Service
-
 Small Animal Micro CT Imaging Experiment Service
-
 Small Animal MRI Imaging Experiment Service
-
 Small Animal Ultrasound Imaging Experiment Service
-
 Transmission Electron Microscopy (TEM) Experiment Service
-
 Scanning Electron Microscope (SEM) Experiment Service
-
 Learning and Memory Behavioral Experiment Service
-
 Anxiety and Depression Behavioral Experiment Service
-
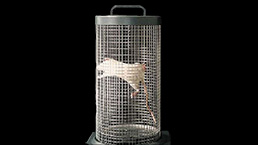 Drug Addiction Behavioral Experiment Service
-
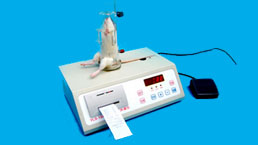 Pain Behavioral Experiment Service
-
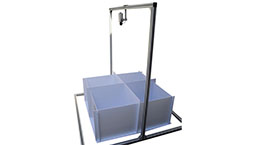 Neuropsychiatric Disorder Behavioral Experiment Service
-
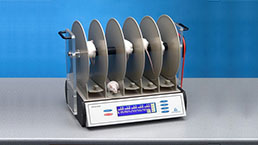 Fatigue Behavioral Experiment Service
-
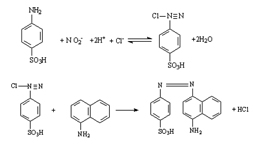 Nitric Oxide Assay Kit (A012)
-
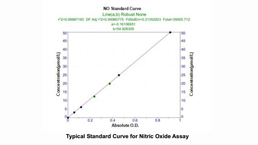 Nitric Oxide Assay Kit (A013-2)
-
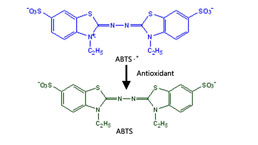 Total Anti-Oxidative Capability Assay Kit(A015-2)
-
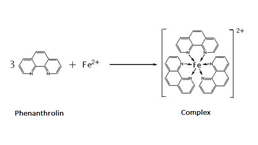 Total Anti-Oxidative Capability Assay Kit (A015-1)
-
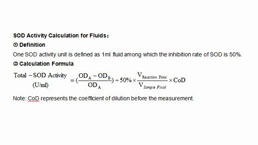 Superoxide Dismutase Assay Kit
-
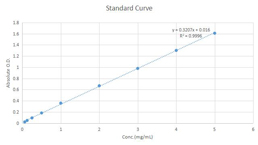 Fructose Assay Kit (A085)
-
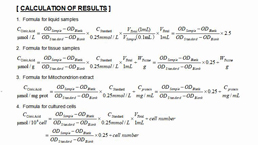 Citric Acid Assay Kit (A128 )
-
 Catalase Assay Kit
-
 Malondialdehyde Assay Kit
-
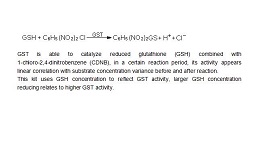 Glutathione S-Transferase Assay Kit
-
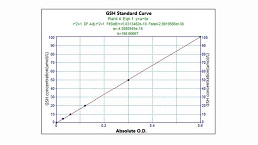 Microscale Reduced Glutathione assay kit
-
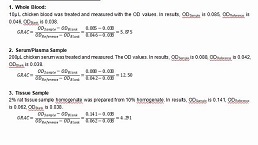 Glutathione Reductase Activity Coefficient Assay Kit
-
 Angiotensin Converting Enzyme Kit
-
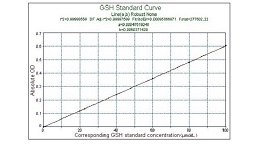 Glutathione Peroxidase (GSH-PX) Assay Kit
-
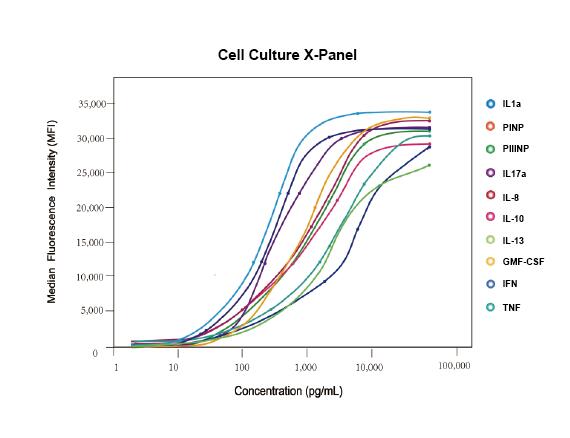 Cloud-Clone Multiplex assay kits


