Mouse Model for Liver Failure (LF) ")

Hepatic failure
- UOM
- FOB US$ 240.00
- Quantity
Overview
Properties
- Product No.DSI556Mu03
- Organism SpeciesMus musculus (Mouse) Same name, Different species.
- Applications疾病模型
Research use only - Downloadn/a
- Category
- Prototype SpeciesHuman
- Sourceinduced by carbon tetrachloride
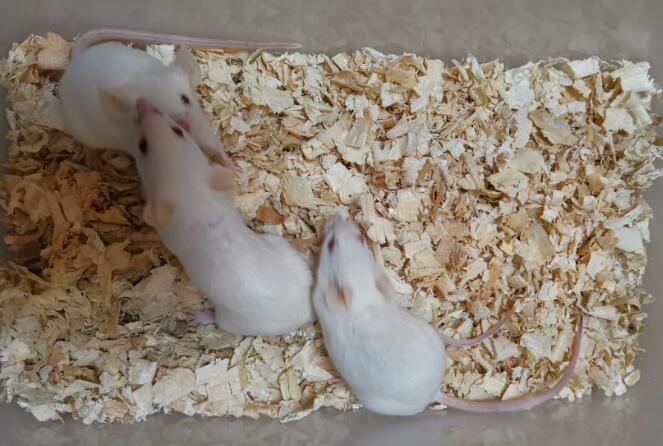
- Model Animal StrainsBalb/c Mice(SPF), healthy, male, age: 8~10weeks, body weight:30g~35g.
- Modeling GroupingRandomly divided into six group: Control group, Model group, Positive drug group and Test drug group.
- Modeling Period12~14 weeks
Sign into your account
Share a new citation as an author
Upload your experimental result
Review

Contact us
Please fill in the blank.
-
 Packages (Simulation)
-
 Packages (Simulation)
-
 Picture
-
 ISO9001: 2008, ISO13485: 2003 Registered
Modeling Method
Modeling method:
Establishment of chronic liver injury model in mice: BALB/ C mice, male, random grouping. Except for normal control group, other mice were intraperitoneally injected 20% CCl4 oil solution (5mL /kg) twice a week for 12 weeks. D-Gal (1g/kg) and LPS (10ug/kg) were intraperitoneally injected after 12 weeks of administration for 3 days.
Intervention administration: TSA (Trichostatin A), sodium n-butyrate, NF-κB inhibitor (PDTC) were administered respectively.
Model evaluation
After modeling, the mice in each group were sacrificed, and the blood was collected and the serum was separated for biochemical detection. Liver and intestinal tissues were collected for pathological examination.
1. Serum biochemical indexes ALT and AST were detected;
2. Liver tissue was taken, fixed, dehydrated and embedded, and paraffin section was prepared.
HE staining and TUNEL fluorescence staining were performed respectively.
3. Intestinal tissue was taken for HE staining.
Intestinal tissue (small intestine) was taken, fixed and embedded, paraffin section prepared, HE staining.
4. Serum was separated and the levels of HMGB1, TNF-α and IL-18 in each group were detected by ELISA.
Pathological results
Cytokines level
The levels of HMGB1, TNF-α and IL-18 in serum samples were detected by ELISA.
Statistical analysis
SPSS software is used for statistical analysis, measurement data to mean ± standard deviation (x ±s), using t test and single factor analysis of variance for group comparison , P<0.05 indicates there was a significant difference, P<0.01 indicates there are very significant differences.
Giveaways

Increment services
-
 Tissue/Sections Customized Service
-
 Serums Customized Service
-
 Immunohistochemistry (IHC) Experiment Service
-
 Small Animal In Vivo Imaging Experiment Service
-
 Small Animal Micro CT Imaging Experiment Service
-
 Small Animal MRI Imaging Experiment Service
-
 Small Animal Ultrasound Imaging Experiment Service
-
 Transmission Electron Microscopy (TEM) Experiment Service
-
 Scanning Electron Microscope (SEM) Experiment Service
-
 Learning and Memory Behavioral Experiment Service
-
 Anxiety and Depression Behavioral Experiment Service
-
 Drug Addiction Behavioral Experiment Service
-
 Pain Behavioral Experiment Service
-
 Neuropsychiatric Disorder Behavioral Experiment Service
-
 Fatigue Behavioral Experiment Service
-
 Nitric Oxide Assay Kit (A012)
-
 Nitric Oxide Assay Kit (A013-2)
-
 Total Anti-Oxidative Capability Assay Kit(A015-2)
-
 Total Anti-Oxidative Capability Assay Kit (A015-1)
-
 Superoxide Dismutase Assay Kit
-
 Fructose Assay Kit (A085)
-
 Citric Acid Assay Kit (A128 )
-
 Catalase Assay Kit
-
 Malondialdehyde Assay Kit
-
 Glutathione S-Transferase Assay Kit
-
 Microscale Reduced Glutathione assay kit
-
 Glutathione Reductase Activity Coefficient Assay Kit
-
 Angiotensin Converting Enzyme Kit
-
 Glutathione Peroxidase (GSH-PX) Assay Kit
-
 Cloud-Clone Multiplex assay kits