Mouse Model for Myocardial Infarction (MI) ")

AMI; Acute myocardial infarction; Heart attack
- UOM
- FOB US$ 300.00
- Quantity
Overview
Properties
- Product No.DSI504Mu01
- Organism SpeciesMus musculus (Mouse) Same name, Different species.
- ApplicationsDisease Model
Research use only - Downloadn/a
- CategoryCirculatory system
- Prototype SpeciesHuman
- Sourceinduced by ligation of left anterior descending coronary artery (LAD)
- Model Animal StrainsBalb/c mice(SPF), male, 6w~8w, body weight:20g~22g
- Modeling Grouping1.Randomly divided into six group: Control group, Model group, Positive drug group and Te
- Modeling Period0h、3h、6h、12h、24h、72h
Sign into your account
Share a new citation as an author
Upload your experimental result
Review

Contact us
Please fill in the blank.
-
 Packages (Simulation)
-
 Packages (Simulation)
-
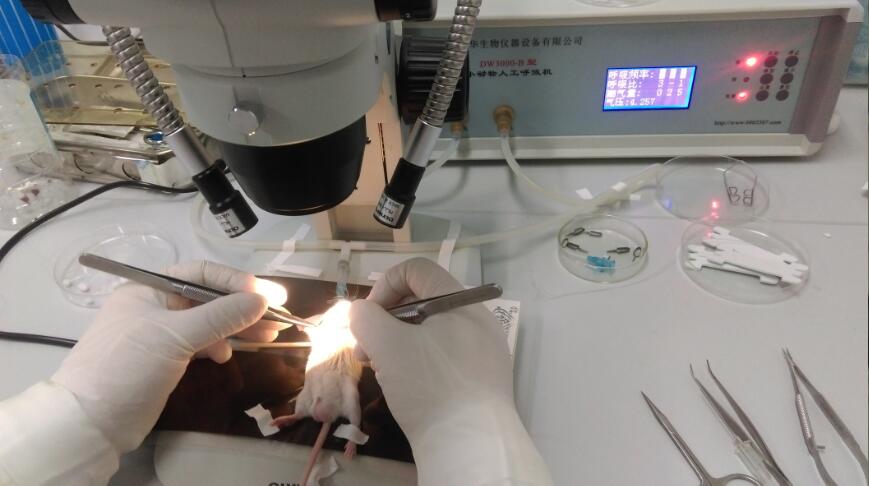 Fig. Microsurgical operation image for mice MI
-
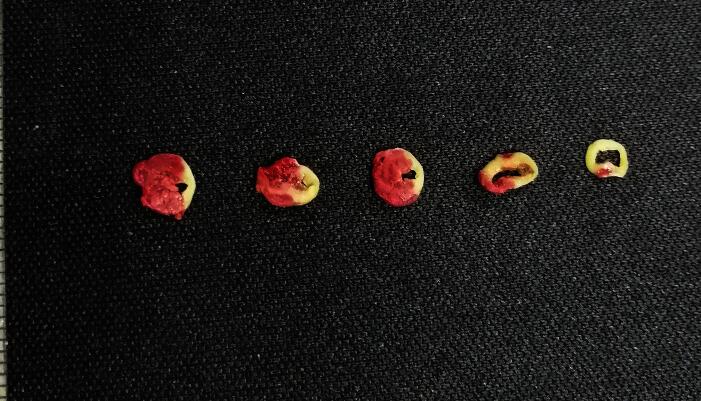 TTC stain of heart,the arrow is infarct area.
-
 ISO9001: 2008, ISO13485: 2003 Registered
Modeling Method
1. Anesthesia with 3% pentobarbital sodium 80mg/kg by intraperitoneal injection, shave the chest and armpit hair with a shaving razor, expose the operation area, disinfection of operation area with iodine and 75% ethanol.
2. Tracheal intubation: after anesthesia, the toe of the test can be performed without reaction. Open the external light microscope, open the ventilator, setting the parameters (respiration frequency 110bpm).Tracheal intubation was inserted into the trachea along the glottis, and the mice were connected to the ventilator. The respiratory status of the mice was observed, and the chest beat was consistent with the frequency of the ventilator. The results indicated that the MI could be performed successfully.
3.In the right lateral decubitus, with ophthalmic scissors in the left forelimb armpit, three or four intercostal chest was opened to expose the heart full cut by microscissors, gently clip a small amount of pericardium and tear a little pericardium in the left ear, to fully expose the left anterior descending coronary artery (LAD) or the region.
4.Coronary artery ligation: under the microscope to find the LAD, with 7-0 with needle suture in the left atrial appendage, the lower edge of the 2mm needle suture, through LAD, to completely block the blood flow of LAD.
5.Close chest: after ligation is completed, 6-0 suture completely open thoracic cavity (to ensure no gap, no dislocation) closed chest, from inside to outside by layer suture each layer of muscle and skin.
6.Pay close attention to the state of the mice after operation, whether there is abnormal breathing. After the mice were naturally recovered, the mice were removed from the ventilator and the trachea was removed.
Model evaluation
1.Cardiac function can be evaluated by ultrasound or hemodynamic testing. B or M-mode ultrasonography images were used to measure left ventricular end diastolic and end systolic diameter (LVIDd, LVIDs), and the corresponding ejection fraction (EF%) and left ventricular short axis shortening (FS%) were calculated automatically.
2.Infarct size measured by TTC staining
Take the heart, squeeze the heart clean and dry it off and dry it at 4°C saline rinse after -20°C for 15 mins to make the heart hardens, remove and insert apex along the direction of the atrioventricular groove cut into 1mm thick sections were cut 5 pieces, and placed in 5ml 37°C TTC phosphate buffer, water bath for 15 mins. After TTC staining, The infarct area was white, and the infarct edge was brick red and the normal area is red.
Pathological results
Remove the heart and remove the blood vessels, fat and other impuritiesth. After weighing put the heart into 4% poly formaldehyde solution for 24 hours, and make the dehydration, embedding, paraffin section, HE staining. HE staining results showed that myocardial aligned and rich cytoplasm uniform, interstitial normal in control group; in model group: part of the myocardial nuclei loss, myocardial cell vacuolization, infarction area visible myocardial tissue disorders, myocardial cells disappeared, replaced by fibrous scar tissue.
Cytokines level
Statistical analysis
SPSS software is used for statistical analysis, measurement data to mean ± standard deviation (x ±s), using t test and single factor analysis of variance for group comparison , P<0.05 indicates there was a significant difference, P<0.01 indicates there are very significant differences.
Giveaways

Increment services
-
 Tissue/Sections Customized Service
-
 Serums Customized Service
-
 Immunohistochemistry (IHC) Experiment Service
-
 Small Animal In Vivo Imaging Experiment Service
-
 Small Animal Micro CT Imaging Experiment Service
-
 Small Animal MRI Imaging Experiment Service
-
 Small Animal Ultrasound Imaging Experiment Service
-
 Transmission Electron Microscopy (TEM) Experiment Service
-
 Scanning Electron Microscope (SEM) Experiment Service
-
 Learning and Memory Behavioral Experiment Service
-
 Anxiety and Depression Behavioral Experiment Service
-
 Drug Addiction Behavioral Experiment Service
-
 Pain Behavioral Experiment Service
-
 Neuropsychiatric Disorder Behavioral Experiment Service
-
 Fatigue Behavioral Experiment Service
-
 Nitric Oxide Assay Kit (A012)
-
 Nitric Oxide Assay Kit (A013-2)
-
 Total Anti-Oxidative Capability Assay Kit(A015-2)
-
 Total Anti-Oxidative Capability Assay Kit (A015-1)
-
 Superoxide Dismutase Assay Kit
-
 Fructose Assay Kit (A085)
-
 Citric Acid Assay Kit (A128 )
-
 Catalase Assay Kit
-
 Malondialdehyde Assay Kit
-
 Glutathione S-Transferase Assay Kit
-
 Microscale Reduced Glutathione assay kit
-
 Glutathione Reductase Activity Coefficient Assay Kit
-
 Angiotensin Converting Enzyme Kit
-
 Glutathione Peroxidase (GSH-PX) Assay Kit
-
 Cloud-Clone Multiplex assay kits