Mouse Model for Tumor Transplantation (TT) ")

Transplanted tumors;TE-1;HepG2;HepG2-luc;SK-MES-1;LL/2-luc-M38
- UOM
- FOB US$ 280.00
- Quantity
Overview
Properties
- Product No.DSI530Mu03
- Organism SpeciesMus musculus (Mouse) Same name, Different species.
- ApplicationsTumor metastasis disease model
Research use only - Downloadn/a
- Category
- Prototype SpeciesHuman
- SourceLiver and lung tumor metastasis caused by melanoma cells (B16)
- Model Animal StrainsC57BL/6 Mice(SPF), healthy, male, age: 4~6weeks, body weight:18g~20g.
- Modeling GroupingRandomly divided into six group: Control group, Model group, Positive drug group and Test drug group(low,medium,high).
- Modeling Period4-6 weeks
Sign into your account
Share a new citation as an author
Upload your experimental result
Review

Contact us
Please fill in the blank.
-
 Packages (Simulation)
-
 Packages (Simulation)
-
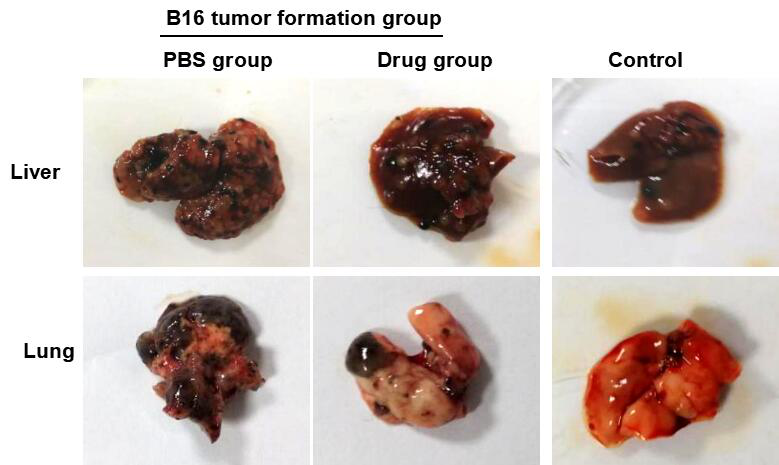 Fig. Liver and lung tumor metastasis on mice
-
 ISO9001: 2008, ISO13485: 2003 Registered
Modeling Method
Mouse tumor formation experiment:
The logarithmic growth cells were taken, digested by trypsin, and then the cells were suspended in the culture medium to adjust the cell density with sterile phosphate buffer solution (PBS).
C57BL/6J mice were selected to establish tumor metastasis model of B16 cells, with 10 mice in each group. In experimental group, 0.1ml of B16 cell suspension at the concentration of 5×10 6 /L was injected into the tail vein. Each group was injected intraperitoneally from the next day after cell inoculation, and then once every other day after 10 days.
On the 21st day, the animals were sacrificed, liver and lung tissues were taken, the number of metastatic nodules was counted under anatomical microscope, digital camera photographed, and the number of lung metastasis nodules in each group of mice was statistically analyzed.
Model evaluation
After the tumor cells were injected into the tail vein of each group, the mice grew well, and there was no significant change in body weight, and no significant difference between groups.On day 21, the mice were sacrificed, and the liver and lung tissues were taken for anatomical observation under microscope. The number of metastatic nodules was counted under anatomical microscope, and the number of liver and lung nodules in the administration group was significantly lower than that in the negative control group.
Take sample:
1.At the end of the experiment, liver tissue, lung tissue and tumor tissue were collected from each group. Each tissue was divided into two parts from the center of the tumor, and one part was fixed in formaldehyde. The other was stored in liquid nitrogen at -80 ° C for molecular biology and WB detection, etc.
Pathological results
Cytokines level
Statistical analysis
SPSS software is used for statistical analysis, measurement data to mean ± standard deviation (x ±s), using t test and single factor analysis of variance for group comparison , P<0.05 indicates there was a significant difference, P<0.01 indicates there are very significant differences.
Giveaways

Increment services
-
 Tissue/Sections Customized Service
-
 Serums Customized Service
-
 Immunohistochemistry (IHC) Experiment Service
-
 Small Animal In Vivo Imaging Experiment Service
-
 Small Animal Micro CT Imaging Experiment Service
-
 Small Animal MRI Imaging Experiment Service
-
 Small Animal Ultrasound Imaging Experiment Service
-
 Transmission Electron Microscopy (TEM) Experiment Service
-
 Scanning Electron Microscope (SEM) Experiment Service
-
 Learning and Memory Behavioral Experiment Service
-
 Anxiety and Depression Behavioral Experiment Service
-
 Drug Addiction Behavioral Experiment Service
-
 Pain Behavioral Experiment Service
-
 Neuropsychiatric Disorder Behavioral Experiment Service
-
 Fatigue Behavioral Experiment Service
-
 Nitric Oxide Assay Kit (A012)
-
 Nitric Oxide Assay Kit (A013-2)
-
 Total Anti-Oxidative Capability Assay Kit(A015-2)
-
 Total Anti-Oxidative Capability Assay Kit (A015-1)
-
 Superoxide Dismutase Assay Kit
-
 Fructose Assay Kit (A085)
-
 Citric Acid Assay Kit (A128 )
-
 Catalase Assay Kit
-
 Malondialdehyde Assay Kit
-
 Glutathione S-Transferase Assay Kit
-
 Microscale Reduced Glutathione assay kit
-
 Glutathione Reductase Activity Coefficient Assay Kit
-
 Angiotensin Converting Enzyme Kit
-
 Glutathione Peroxidase (GSH-PX) Assay Kit
-
 Cloud-Clone Multiplex assay kits