Rabbit Model for Myocardiosis 

Cardiomyopathy
- UOM
- FOB US$
- Quantity
Overview
Properties
- Product No.DSI596Rb02
- Organism SpeciesOryctolagus cuniculus (Rabbit) Same name, Different species.
- Applicationsn/a
Research use only - Downloadn/a
- CategoryCirculatory system
- Prototype SpeciesHuman
- SourceInduced by noradrenaline
- Model Animal StrainsJapanese white rabbit, healthy, male and female, weight 1.5-2.5kg.
- Modeling GroupingRandomly divided into six group: Control group, Model group, Positive drug group and Test drug group(low,medium,high).
- Modeling Period4-6weeks
Sign into your account
Share a new citation as an author
Upload your experimental result
Review

Contact us
Please fill in the blank.
Modeling Method
Use New Zealand Rabbit with body weight of 2-2.5kg, 6months age. Feed for 1 week before experiment. Fix the rabbit in cage without anesthesia, intravenous infusion of norepinephrine at a dose of 1mg/kg body weight. Add norepinephrine to 40ml of physiological saline, infusion through the ear vein, finish within 90mins. Continuous administration of 15 times then collect of experimental data and specimens. Keep the animal supine, Take heart blood, heparin anticoagulation, determine intracellular calcium and magnesium content and detection of hemorheology. Then chest out the heart, divided into three parts, ①Take ventricular tissue 0. 5-1.0g for determination of calcium and magnesium in myocardium. ② Take 4 of 1-3mm size tissue at the apical Department, immediately put 4% glutaraldehyde and 0. 1% osmium for double fixation. It is for electron microscopic observation of myocardial ultrastructure. ③Fix the rest tissue 10% formaldehyde solution for pathology light microscopy.
Model evaluation
Pathological results
Cytokines level
Statistical analysis
SPSS software is used for statistical analysis, measurement data to mean ± standard deviation (x ±s), using t test and single factor analysis of variance for group comparison , P<0.05 indicates there was a significant difference, P<0.01 indicates there are very significant differences.
Giveaways
Increment services
-
 Tissue/Sections Customized Service
-
 Serums Customized Service
-
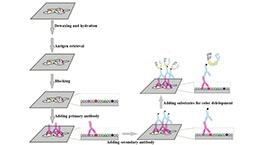 Immunohistochemistry (IHC) Experiment Service
-
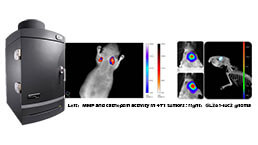 Small Animal In Vivo Imaging Experiment Service
-
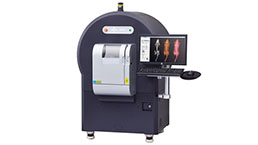 Small Animal Micro CT Imaging Experiment Service
-
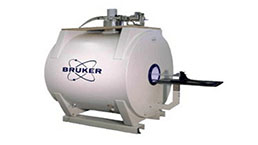 Small Animal MRI Imaging Experiment Service
-
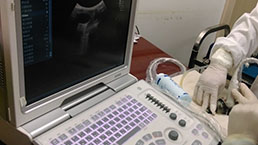 Small Animal Ultrasound Imaging Experiment Service
-
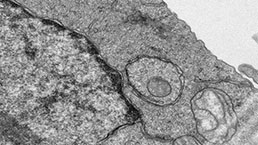 Transmission Electron Microscopy (TEM) Experiment Service
-
 Scanning Electron Microscope (SEM) Experiment Service
-
 Learning and Memory Behavioral Experiment Service
-
 Anxiety and Depression Behavioral Experiment Service
-
 Drug Addiction Behavioral Experiment Service
-
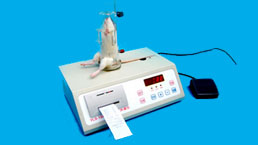 Pain Behavioral Experiment Service
-
 Neuropsychiatric Disorder Behavioral Experiment Service
-
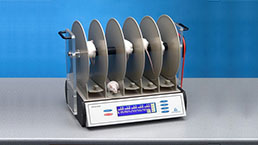 Fatigue Behavioral Experiment Service
-
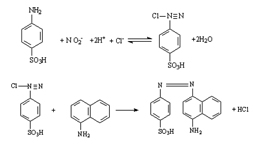 Nitric Oxide Assay Kit (A012)
-
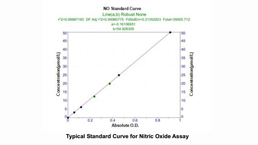 Nitric Oxide Assay Kit (A013-2)
-
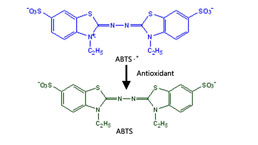 Total Anti-Oxidative Capability Assay Kit(A015-2)
-
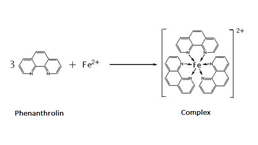 Total Anti-Oxidative Capability Assay Kit (A015-1)
-
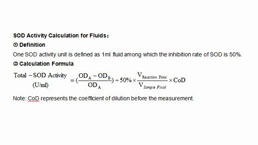 Superoxide Dismutase Assay Kit
-
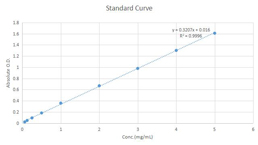 Fructose Assay Kit (A085)
-
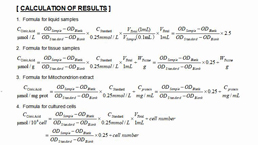 Citric Acid Assay Kit (A128 )
-
 Catalase Assay Kit
-
 Malondialdehyde Assay Kit
-
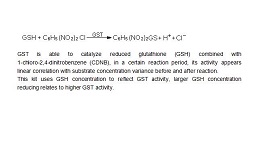 Glutathione S-Transferase Assay Kit
-
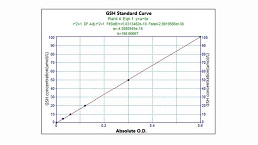 Microscale Reduced Glutathione assay kit
-
 Glutathione Reductase Activity Coefficient Assay Kit
-
 Angiotensin Converting Enzyme Kit
-
 Glutathione Peroxidase (GSH-PX) Assay Kit
-
 Cloud-Clone Multiplex assay kits


