Rat Model for Alzheimer Disease (AD) ")

Alzheimer's
- UOM
- FOB US$ 280.00
- Quantity
Overview
Properties
- Product No.DSI707Ra01
- Organism SpeciesRattus norvegicus (Rat) Same name, Different species.
- ApplicationsDiesase model
Research use only - Downloadn/a
- CategoryCerebral and nervous systems
- Prototype SpeciesHuman
- SourceInduced by physical method and medicine
- Model Animal StrainsSD Rats (SPF), healthy, male, body weight 250g~300g.
- Modeling GroupingRandomly divided into six group: Control group, Model group, Positive drug group and Test drug group.
- Modeling Period4-6 weeks
Sign into your account
Share a new citation as an author
Upload your experimental result
Review

Contact us
Please fill in the blank.
-
 Packages (Simulation)
-
 Packages (Simulation)
-
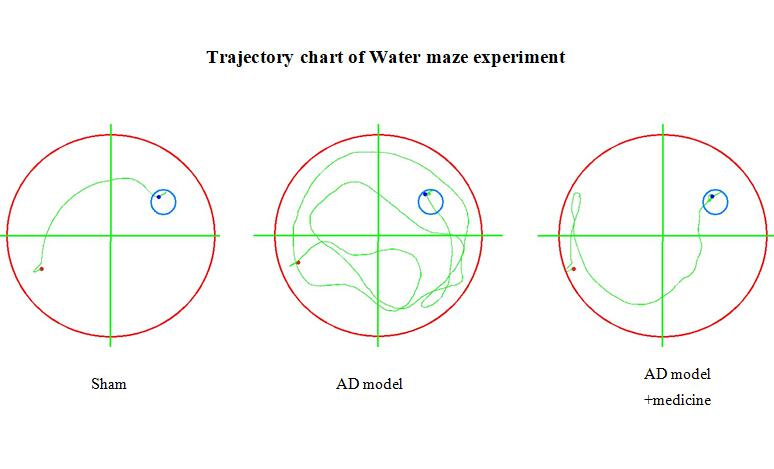 Fig.Trajectory chart of water maze experiment
-
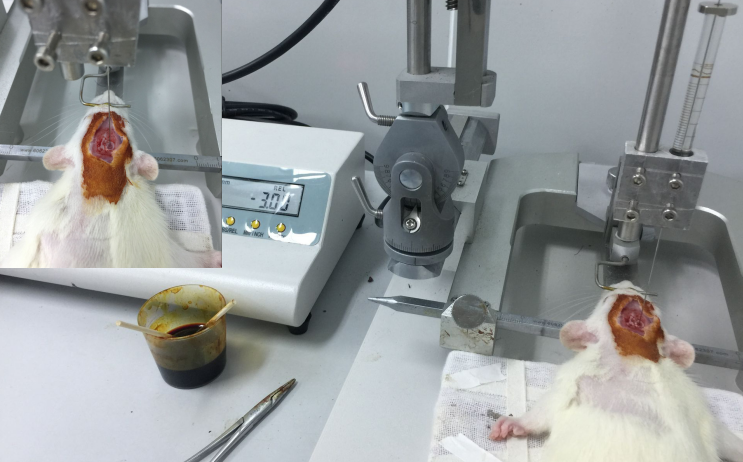 Fig. Microinjection of Aβ1-40
-
 ISO9001: 2008, ISO13485: 2003 Registered
Modeling Method
SD rats were anesthetized with 1% pentobarbital sodium (40ug/g) intraperitoneal injection, then fixed on the stereotaxic apparatus. According to the rat stereotaxic apparatus map, bregma is origin and puncture is 3.5 mm behind the origin. Cut 2mm along the right side of the central line, open the harnpan with a dental drill, using a micro syringe insert 3mm from brain surface, (AP= -3.5 mm, ML=2.0 mm, DV=3.0 mm). Bilateral hippocampal CA1 region was injected with Aβ1-40 (10ug (1μL)) respectively, retain the needle 5min, then suture wound. 3 days after modeling, caudal vein injection of normal saline, drug given for 100μl/day last 21 days, behavior detection of Morris.
Model evaluation
Behavior detection:
21 days after drug administration, morris for all groups. The experiment is divided into place navigation test and spatial probe test.
1. Place navigation test: Rats were trained for 5 days, 4 times a day, 30min for each interval. Record the time it takes rats to find the platform from 4 entry points, i.e. incubation. The average score of the four incubation as the final result of the day entered the final statistics.
2. Spatial probe test: 6th days of the test, remove platform, from the furthest end of the platform into the water. Record the swimming track of rats within 30s, observe and analyse the residence time in the target quadrant and times to pass through the platform.
After behavior detection, remove brain in each group, peel the epencephal on ice, symmetrically cut the rest into halves. One half fixed in 4% paraformaldehyde for pathological examination and another takes the hippocampus for PCR and protein detection.
Pathological results
1. Nissl's staining
Hippocampal fixed paraffin sections, Nissl staining, observation of the morphology and number of neurons in the hippocampal region. Under the light microscope, count and analyze the number of neurons at the same site of each group.
2. IF staining
IF staining, observation of Aβ1-40 staining in hippocampus. Under the fluorescence microscope, count and analyze the number of positive plaque at the same site of each group.
3. TUNEL staining
TUNEL staining, observation of neuronal apoptosis. Under the fluorescence microscope, count and analyze the number of positive staining at the same site of each group.
Cytokines level
1. RT-qPCR
Collect hippocampal tissue, extract RNA, reverse transcribe cDNA, detect expression of caspase-3, Bcl-2 and Bax by PCR.
2. Western-blot
Collect hippocampal tissue, detect protein expression of active-caspase-3, Bcl-2 and Bax.
Statistical analysis
SPSS software is used for statistical analysis, measurement data to mean ± standard deviation (x ±s), using t test and single factor analysis of variance for group comparison , P<0.05 indicates there was a significant difference, P<0.01 indicates there are very significant differences.
Giveaways

Increment services
-
 Tissue/Sections Customized Service
-
 Serums Customized Service
-
 Immunohistochemistry (IHC) Experiment Service
-
 Small Animal In Vivo Imaging Experiment Service
-
 Small Animal Micro CT Imaging Experiment Service
-
 Small Animal MRI Imaging Experiment Service
-
 Small Animal Ultrasound Imaging Experiment Service
-
 Transmission Electron Microscopy (TEM) Experiment Service
-
 Scanning Electron Microscope (SEM) Experiment Service
-
 Learning and Memory Behavioral Experiment Service
-
 Anxiety and Depression Behavioral Experiment Service
-
 Drug Addiction Behavioral Experiment Service
-
 Pain Behavioral Experiment Service
-
 Neuropsychiatric Disorder Behavioral Experiment Service
-
 Fatigue Behavioral Experiment Service
-
 Nitric Oxide Assay Kit (A012)
-
 Nitric Oxide Assay Kit (A013-2)
-
 Total Anti-Oxidative Capability Assay Kit(A015-2)
-
 Total Anti-Oxidative Capability Assay Kit (A015-1)
-
 Superoxide Dismutase Assay Kit
-
 Fructose Assay Kit (A085)
-
 Citric Acid Assay Kit (A128 )
-
 Catalase Assay Kit
-
 Malondialdehyde Assay Kit
-
 Glutathione S-Transferase Assay Kit
-
 Microscale Reduced Glutathione assay kit
-
 Glutathione Reductase Activity Coefficient Assay Kit
-
 Angiotensin Converting Enzyme Kit
-
 Glutathione Peroxidase (GSH-PX) Assay Kit
-
 Cloud-Clone Multiplex assay kits