- Featured-Product
Rat Model for Colitis ")

- UOM
- FOB US$ 200.00
- Quantity
Overview
Properties
- Product No.DSI515Ra02
- Organism SpeciesRattus norvegicus (Rat) Same name, Different species.
- ApplicationsDisease Model
Research use only - Downloadn/a
- Category
- Prototype SpeciesHuman
- Sourceinduced by TNBS
- Model Animal StrainsSD Rats(SPF), healthy, male and female, body weight 180g~200g.
- Modeling GroupingRandomly divided into six group: Control group, Model group, Positive drug group and Test drug group.
- Modeling Period4-6 weeks
Sign into your account
Share a new citation as an author
Upload your experimental result
Review

Contact us
Please fill in the blank.
-
 Packages (Simulation)
-
 Packages (Simulation)
-
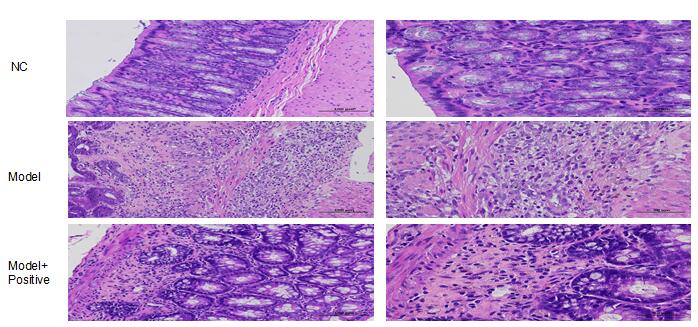 Fig.HE staining on colon of Rats
-
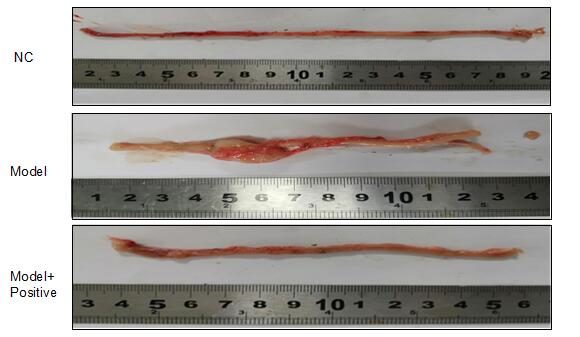 Fig. Colonic tissue of Rats
-
 ISO9001: 2008, ISO13485: 2003 Registered
Modeling Method
After anesthesia, a plastic tube with a diameter of 2.0 mm and a length of about 12 cm was gently inserted into the anus of the rats with a depth of about 8 cm, and a certain concentration of ETHANOL solution of TNBS was slowly injected into the rats, which was completed within 1 min.After administration, the plastic tube was pulled out slowly, the anus was pinched by hand, the tail of the rat was lifted, and the tail of the rat was held upside down for 3min to avoid the outflow of the molding reagent, so that the molding agent could fully penetrate into the intestinal cavity of the rat.Animals in control group were given the same volume of normal saline and enema as described above.The animals in each group were fed normally.
Note: Ethanol solution of TNBS (mixture of TNBS aqueous solution with volume fraction of 5% and anhydrous ethanol with volume of 2:1) is now available.
Model evaluation
1. Observation and weight record
Situation observation: observe the situation of each group of animals, if there are unexpected symptoms, record the situation and timely feedback.Record possible mortality rates.
Body weight recording: From the day before administration, the weight of each group was weighed and recorded every three days until the end of administration, and the curve of body weight change was plotted.During the experiment, the body weight was recorded for 10 times and the change curve was plotted.
2. Sampling of intestinal tissue and general score
After euthanization, the whole section of colon tissue from anus upwards was collected.
Colon length was measured for macro evaluation.
Each colon tissue was photographed with a ruler, and the original general morphology was recorded and scored according to the scoring criteria.
The general scoring criteria of colon tissue are as follows:
0 point: No damage
1 point: Congestion but no ulcer
2 points: Hyperemia with thickened bowel wall but no ulcers
3 points: There is a small ulceration, the longest measuring 0-1cm
4 points: The ulcer is large, the longest diameter is about 1-2cm
5 points: The ulcer is large, the longest diameter >2cm
The specific score of each colon tissue was recorded according to the above scoring criteria.
Scoring criteria References:Wallace JL, Keenan CM. An orally active inhibitro of leukotriene synthesis accelerates healing in a rat model of colitis. Am J Physiol,1990 258:G527-G534
3. Pathological staining of colon tissue
Tissue treatment: Each colon was divided into 3 segments, and the location of samples from each animal should be as consistent as possible (regardless of whether there was pathological damage at the shear site).The first 1 cm of the 3 sections of tissue were respectively taken and put into the same EP tube for quick freezing and reserve (It can be used for molecular detection).The remaining 3 tissue fragments were fixed with 10% neutral formalin for 48 h, rolled into "Swiss roll", embedded in paraffin, and sliced so that the whole area around the colon could be seen.HE staining was performed for histopathological observation.Each sample was scored for pathology and statistically summarized.
Pathological results
Cytokines level
On the 27th day (24h after the last administration), the serum of each group was divided into two parts and stored at -80℃.
The contents of IL-10 and TNF-α in one of the serum samples were detected by ELISA.
Statistical analysis
SPSS software is used for statistical analysis, measurement data to mean ± standard deviation (x ±s), using t test and single factor analysis of variance for group comparison , P<0.05 indicates there was a significant difference, P<0.01 indicates there are very significant differences.
Giveaways

Increment services
-
 Tissue/Sections Customized Service
-
 Serums Customized Service
-
 Immunohistochemistry (IHC) Experiment Service
-
 Small Animal In Vivo Imaging Experiment Service
-
 Small Animal Micro CT Imaging Experiment Service
-
 Small Animal MRI Imaging Experiment Service
-
 Small Animal Ultrasound Imaging Experiment Service
-
 Transmission Electron Microscopy (TEM) Experiment Service
-
 Scanning Electron Microscope (SEM) Experiment Service
-
 Learning and Memory Behavioral Experiment Service
-
 Anxiety and Depression Behavioral Experiment Service
-
 Drug Addiction Behavioral Experiment Service
-
 Pain Behavioral Experiment Service
-
 Neuropsychiatric Disorder Behavioral Experiment Service
-
 Fatigue Behavioral Experiment Service
-
 Nitric Oxide Assay Kit (A012)
-
 Nitric Oxide Assay Kit (A013-2)
-
 Total Anti-Oxidative Capability Assay Kit(A015-2)
-
 Total Anti-Oxidative Capability Assay Kit (A015-1)
-
 Superoxide Dismutase Assay Kit
-
 Fructose Assay Kit (A085)
-
 Citric Acid Assay Kit (A128 )
-
 Catalase Assay Kit
-
 Malondialdehyde Assay Kit
-
 Glutathione S-Transferase Assay Kit
-
 Microscale Reduced Glutathione assay kit
-
 Glutathione Reductase Activity Coefficient Assay Kit
-
 Angiotensin Converting Enzyme Kit
-
 Glutathione Peroxidase (GSH-PX) Assay Kit
-
 Cloud-Clone Multiplex assay kits