Rat Model for Hyperuricemia (HU) ")

- UOM
- FOB US$ 200.00
- Quantity
Overview
Properties
- Product No.DSI677Ra01
- Organism SpeciesRattus norvegicus (Rat) Same name, Different species.
- ApplicationsDisease Model
Research use only - Downloadn/a
- CategoryUrinary system
- Prototype SpeciesHuman
- SourceInduced by oteracil potassium, ethambutol and adenine
- Model Animal StrainsWistar Rats( SPF), healthy, male, 6~8W,body weight 180g~200g.
- Modeling GroupingRandomly divided into six group: Control group, Model group, Positive drug group and Test drug group.
- Modeling Period3-4 weeks
Sign into your account
Share a new citation as an author
Upload your experimental result
Review

Contact us
Please fill in the blank.
-
 Packages (Simulation)
-
 Packages (Simulation)
-
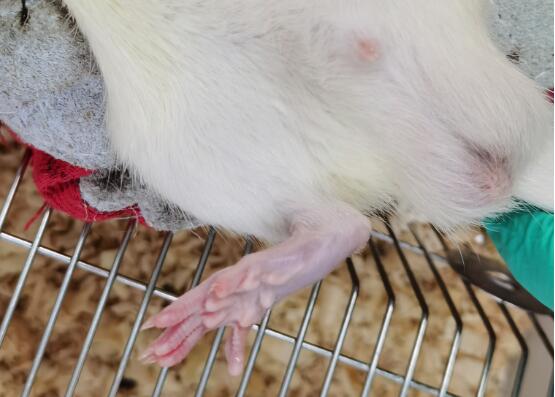 Fig.The foot of HUA rat
-
 ISO9001: 2008, ISO13485: 2003 Registered
Modeling Method
1. Oteracil potassium dissolved in 0.5% sodium carboxymethyl cellulose, the rats were given intragastric administration of potassium (1.5g/KG) for a total of 1 times, continuous intragastric administration for a period of 21 days, the control group was given the same volume of sodium carboxymethyl cellulose.
2 specimens were collected: the rats were anesthetized and the blood samples were taken from the inferior vena cava.
Model evaluation
Biochemical analyzer was used to detect the content of serum uric acid, urea nitrogen and creatinine.
1. Changes of arthritis degree in acute gout rats
(1) The joint swelling degree was scored with vernier caliper, measured 3 times, and taked the average value.
Joint swelling (mm) = ankle diameter after modeling (mm)- ankle diameter before modeling (mm). Joint swelling was detected at 2h, 6h, 24h and 48h, respectively.
(2) The plantar thickness is detected by digital calipers
Plantar thickness was measured at 2h, 6h, 24h and 48h, respectively.
2.Pathological changes of joints in acute gout rats
The pathological states of the ankle joint and paw of each group were photographed by camera at 2h, 6h, 24h and 48h, respectively.
3.Arthritis pain value of gout rats
The mechanical pain threshold of rats at 2h, 6h, 24h, and 48h was measured by "Von Frey Hairs pain meter".
4.Number of inflammatory cells in blood of acute gout rats
Flow cytometry was used to mark the total number of cells, neutrophils, monocytes and eosinophils in blood at 6h and 24h.
Pathological results
5. Pathological changes of kidney: HE staining was used to detect the pathological changes of renal tissue in each group.
Cytokines level
Statistical analysis
SPSS software is used for statistical analysis, measurement data to mean ± standard deviation (x ±s), using t test and single factor analysis of variance for group comparison , P<0.05 indicates there was a significant difference, P<0.01 indicates there are very significant differences.
Giveaways

Increment services
-
 Tissue/Sections Customized Service
-
 Serums Customized Service
-
 Immunohistochemistry (IHC) Experiment Service
-
 Small Animal In Vivo Imaging Experiment Service
-
 Small Animal Micro CT Imaging Experiment Service
-
 Small Animal MRI Imaging Experiment Service
-
 Small Animal Ultrasound Imaging Experiment Service
-
 Transmission Electron Microscopy (TEM) Experiment Service
-
 Scanning Electron Microscope (SEM) Experiment Service
-
 Learning and Memory Behavioral Experiment Service
-
 Anxiety and Depression Behavioral Experiment Service
-
 Drug Addiction Behavioral Experiment Service
-
 Pain Behavioral Experiment Service
-
 Neuropsychiatric Disorder Behavioral Experiment Service
-
 Fatigue Behavioral Experiment Service
-
 Nitric Oxide Assay Kit (A012)
-
 Nitric Oxide Assay Kit (A013-2)
-
 Total Anti-Oxidative Capability Assay Kit(A015-2)
-
 Total Anti-Oxidative Capability Assay Kit (A015-1)
-
 Superoxide Dismutase Assay Kit
-
 Fructose Assay Kit (A085)
-
 Citric Acid Assay Kit (A128 )
-
 Catalase Assay Kit
-
 Malondialdehyde Assay Kit
-
 Glutathione S-Transferase Assay Kit
-
 Microscale Reduced Glutathione assay kit
-
 Glutathione Reductase Activity Coefficient Assay Kit
-
 Angiotensin Converting Enzyme Kit
-
 Glutathione Peroxidase (GSH-PX) Assay Kit
-
 Cloud-Clone Multiplex assay kits