Rat Model for Iron Deficiency Anemia (IDA) 

Iron-deficiency anaemia
- UOM
- FOB US$
- Quantity
Overview
Properties
- Product No.DSI595Ra02
- Organism SpeciesRattus norvegicus (Rat) Same name, Different species.
- Applicationsn/a
Research use only - Downloadn/a
- CategoryHemolymphatic system
- Prototype SpeciesHuman
- SourceInduced by Low iron feeding and small amount bloodletting regularly
- Model Animal StrainsWistar Rats(SPF), healthy, male, body weight 180g~200g.
- Modeling GroupingRandomly divided into six group: Control group, Model group, Positive drug group and Test drug group.
- Modeling Period4-6 weeks
Sign into your account
Share a new citation as an author
Upload your experimental result
Review

Contact us
Please fill in the blank.
Modeling Method
1) Take AOAC formula as reference , the mixture of low iron based feed, trace elements and vitamin formula of the mixture. On this basis, change the casein instead of egg albumin, change cellulose into microcrystalline cellulose. (2) the body weight about 65 g, the Hb content is more than 130 g/L, age of 4 weeks weanling SD rats. Were randomly divided into control group (group C) and iron deficiency anemia group (IDA group), two groups of rats were fed low iron feed, free food, drink deionized water. Control group are given iron dextran by intraperitoneal injection of 5 mg before model construction, then have intraperitoneal injection of this dose once a week. Weight record once a week, and test the caudal vein blood Hb. From the third week, IDA group, besides feeding low iron feed ,add tail vein bloodletting,2 times/week, 1-1.5m everytime. after about eight weeks, rats Hb in IDA group were 60 g/L. stop bleedletting and observe 2 weeks,Hb values still continued to decline. on 10th week, make the animals dead with cervical dislocation. Measure serum total protein, albumin, Hb content, and test the serum iron and total iron binding force index etc.
Model evaluation
Pathological results
Cytokines level
Statistical analysis
SPSS software is used for statistical analysis, measurement data to mean ± standard deviation (x ±s), using t test and single factor analysis of variance for group comparison , P<0.05 indicates there was a significant difference, P<0.01 indicates there are very significant differences.
Giveaways
Increment services
-
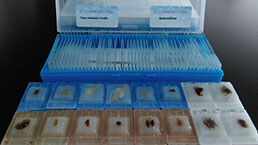 Tissue/Sections Customized Service
-
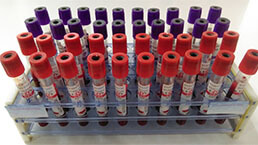 Serums Customized Service
-
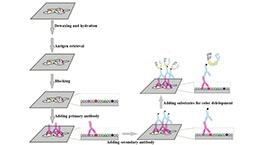 Immunohistochemistry (IHC) Experiment Service
-
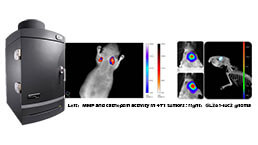 Small Animal In Vivo Imaging Experiment Service
-
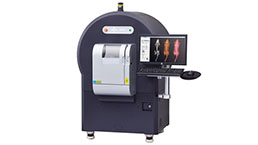 Small Animal Micro CT Imaging Experiment Service
-
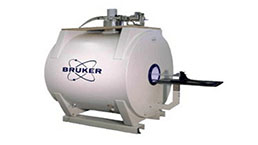 Small Animal MRI Imaging Experiment Service
-
 Small Animal Ultrasound Imaging Experiment Service
-
 Transmission Electron Microscopy (TEM) Experiment Service
-
 Scanning Electron Microscope (SEM) Experiment Service
-
 Learning and Memory Behavioral Experiment Service
-
 Anxiety and Depression Behavioral Experiment Service
-
 Drug Addiction Behavioral Experiment Service
-
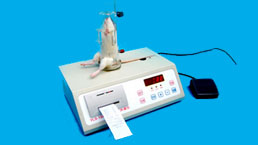 Pain Behavioral Experiment Service
-
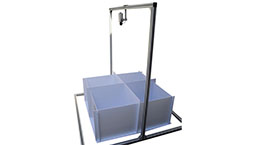 Neuropsychiatric Disorder Behavioral Experiment Service
-
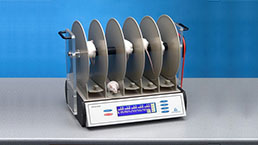 Fatigue Behavioral Experiment Service
-
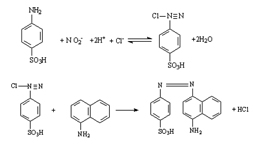 Nitric Oxide Assay Kit (A012)
-
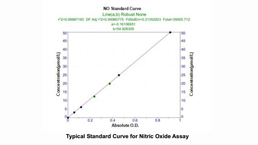 Nitric Oxide Assay Kit (A013-2)
-
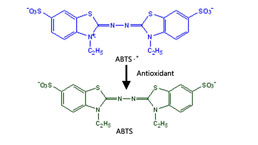 Total Anti-Oxidative Capability Assay Kit(A015-2)
-
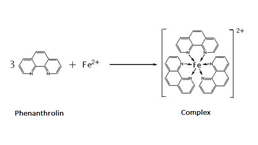 Total Anti-Oxidative Capability Assay Kit (A015-1)
-
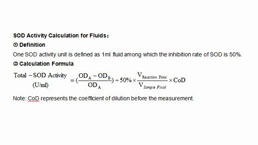 Superoxide Dismutase Assay Kit
-
 Fructose Assay Kit (A085)
-
 Citric Acid Assay Kit (A128 )
-
 Catalase Assay Kit
-
 Malondialdehyde Assay Kit
-
 Glutathione S-Transferase Assay Kit
-
 Microscale Reduced Glutathione assay kit
-
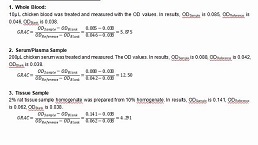 Glutathione Reductase Activity Coefficient Assay Kit
-
 Angiotensin Converting Enzyme Kit
-
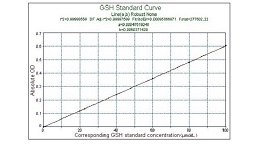 Glutathione Peroxidase (GSH-PX) Assay Kit
-
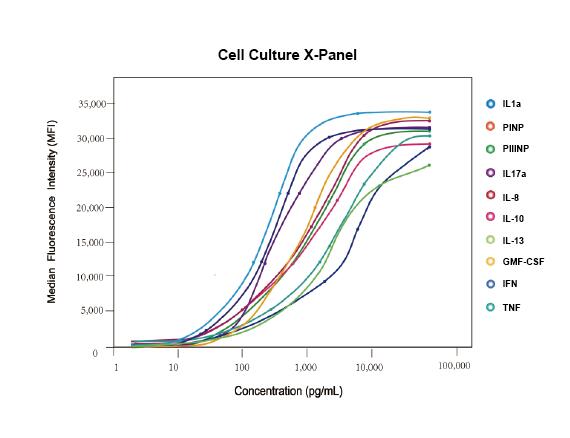 Cloud-Clone Multiplex assay kits


