Rat Model for Periodontitis (PD) ")

Pyorrhea; Periodontal Disease
- UOM
- FOB US$ 240.00
- Quantity
Overview
Properties
- Product No.DSI547Ra02
- Organism SpeciesRattus norvegicus (Rat) Same name, Different species.
- ApplicationsProvide an ideal animal model for the study of periodontitis
Research use only - Downloadn/a
- Category
- Prototype SpeciesHuman
- Sourceinduced by Neck ligation
- Model Animal StrainsSPF Wistar rats, the teeth were intact, without caries and periodontal abnormalities, healthy, male,
- Modeling GroupingRandomly divided into six group: Control group, Model group, Positive drug group and Test drug group.
- Modeling Period6 weeks
Sign into your account
Share a new citation as an author
Upload your experimental result
Review

Contact us
Please fill in the blank.
-
 Packages (Simulation)
-
 Packages (Simulation)
-
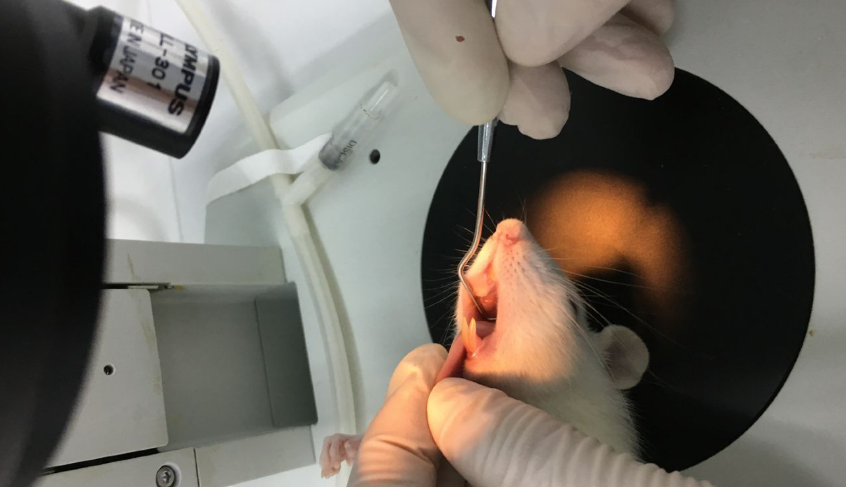 Fig. ligatation of molar with orthodontic stainless steel wire
-
 ISO9001: 2008, ISO13485: 2003 Registered
Modeling Method
1. rats were anesthetized with intraperitoneal injection of 10% chloral hydrate (350mg/kg).
2. Dental probe separate first and second molar tooth gap, with the diameter of 0.2mm orthodontic stainless steel wire ligation of bilateral maxillary first molar tooth neck, with a needle holder holding a ligation wire into the rats from the bilateral maxillary first molars in the palatal, around the maxillary first molar after a week in the palatal side nearly at the fixed end of wire ligation, ligation of 3mm in subgingival retention back bend, prevent ligature scratch intraoral soft tissue, and no damage to the gingival junctional epithelium.
3. Close observation the state of rats after fed sugar water from the day of the experiment, sugar diet (drinking water was 10% glucose water, feed 10% glucose water immersion becomes routine diet soft)every day. Observe the condition of periodontal tissue and the periodontal every week after surgery.
Model evaluation
Pathological results
Cytokines level
Statistical analysis
SPSS software is used for statistical analysis, measurement data to mean ± standard deviation (x ±s), using t test and single factor analysis of variance for group comparison , P<0.05 indicates there was a significant difference, P<0.01 indicates there are very significant differences.
Giveaways

Increment services
-
 Tissue/Sections Customized Service
-
 Serums Customized Service
-
 Immunohistochemistry (IHC) Experiment Service
-
 Small Animal In Vivo Imaging Experiment Service
-
 Small Animal Micro CT Imaging Experiment Service
-
 Small Animal MRI Imaging Experiment Service
-
 Small Animal Ultrasound Imaging Experiment Service
-
 Transmission Electron Microscopy (TEM) Experiment Service
-
 Scanning Electron Microscope (SEM) Experiment Service
-
 Learning and Memory Behavioral Experiment Service
-
 Anxiety and Depression Behavioral Experiment Service
-
 Drug Addiction Behavioral Experiment Service
-
 Pain Behavioral Experiment Service
-
 Neuropsychiatric Disorder Behavioral Experiment Service
-
 Fatigue Behavioral Experiment Service
-
 Nitric Oxide Assay Kit (A012)
-
 Nitric Oxide Assay Kit (A013-2)
-
 Total Anti-Oxidative Capability Assay Kit(A015-2)
-
 Total Anti-Oxidative Capability Assay Kit (A015-1)
-
 Superoxide Dismutase Assay Kit
-
 Fructose Assay Kit (A085)
-
 Citric Acid Assay Kit (A128 )
-
 Catalase Assay Kit
-
 Malondialdehyde Assay Kit
-
 Glutathione S-Transferase Assay Kit
-
 Microscale Reduced Glutathione assay kit
-
 Glutathione Reductase Activity Coefficient Assay Kit
-
 Angiotensin Converting Enzyme Kit
-
 Glutathione Peroxidase (GSH-PX) Assay Kit
-
 Cloud-Clone Multiplex assay kits